
This feature is only available to Pro users.
Overview
The Tokenomics pane provides a full-screen, detailed view of a project’s allocations and release schedules. Tokenomics defines the long-term sustainability of a project — a project may have strong fundamentals, but if emissions are concentrated in certain allocations or subject to vague governance processes, the risks can be significant. Here, you can explore every allocation in detail to assess that balance.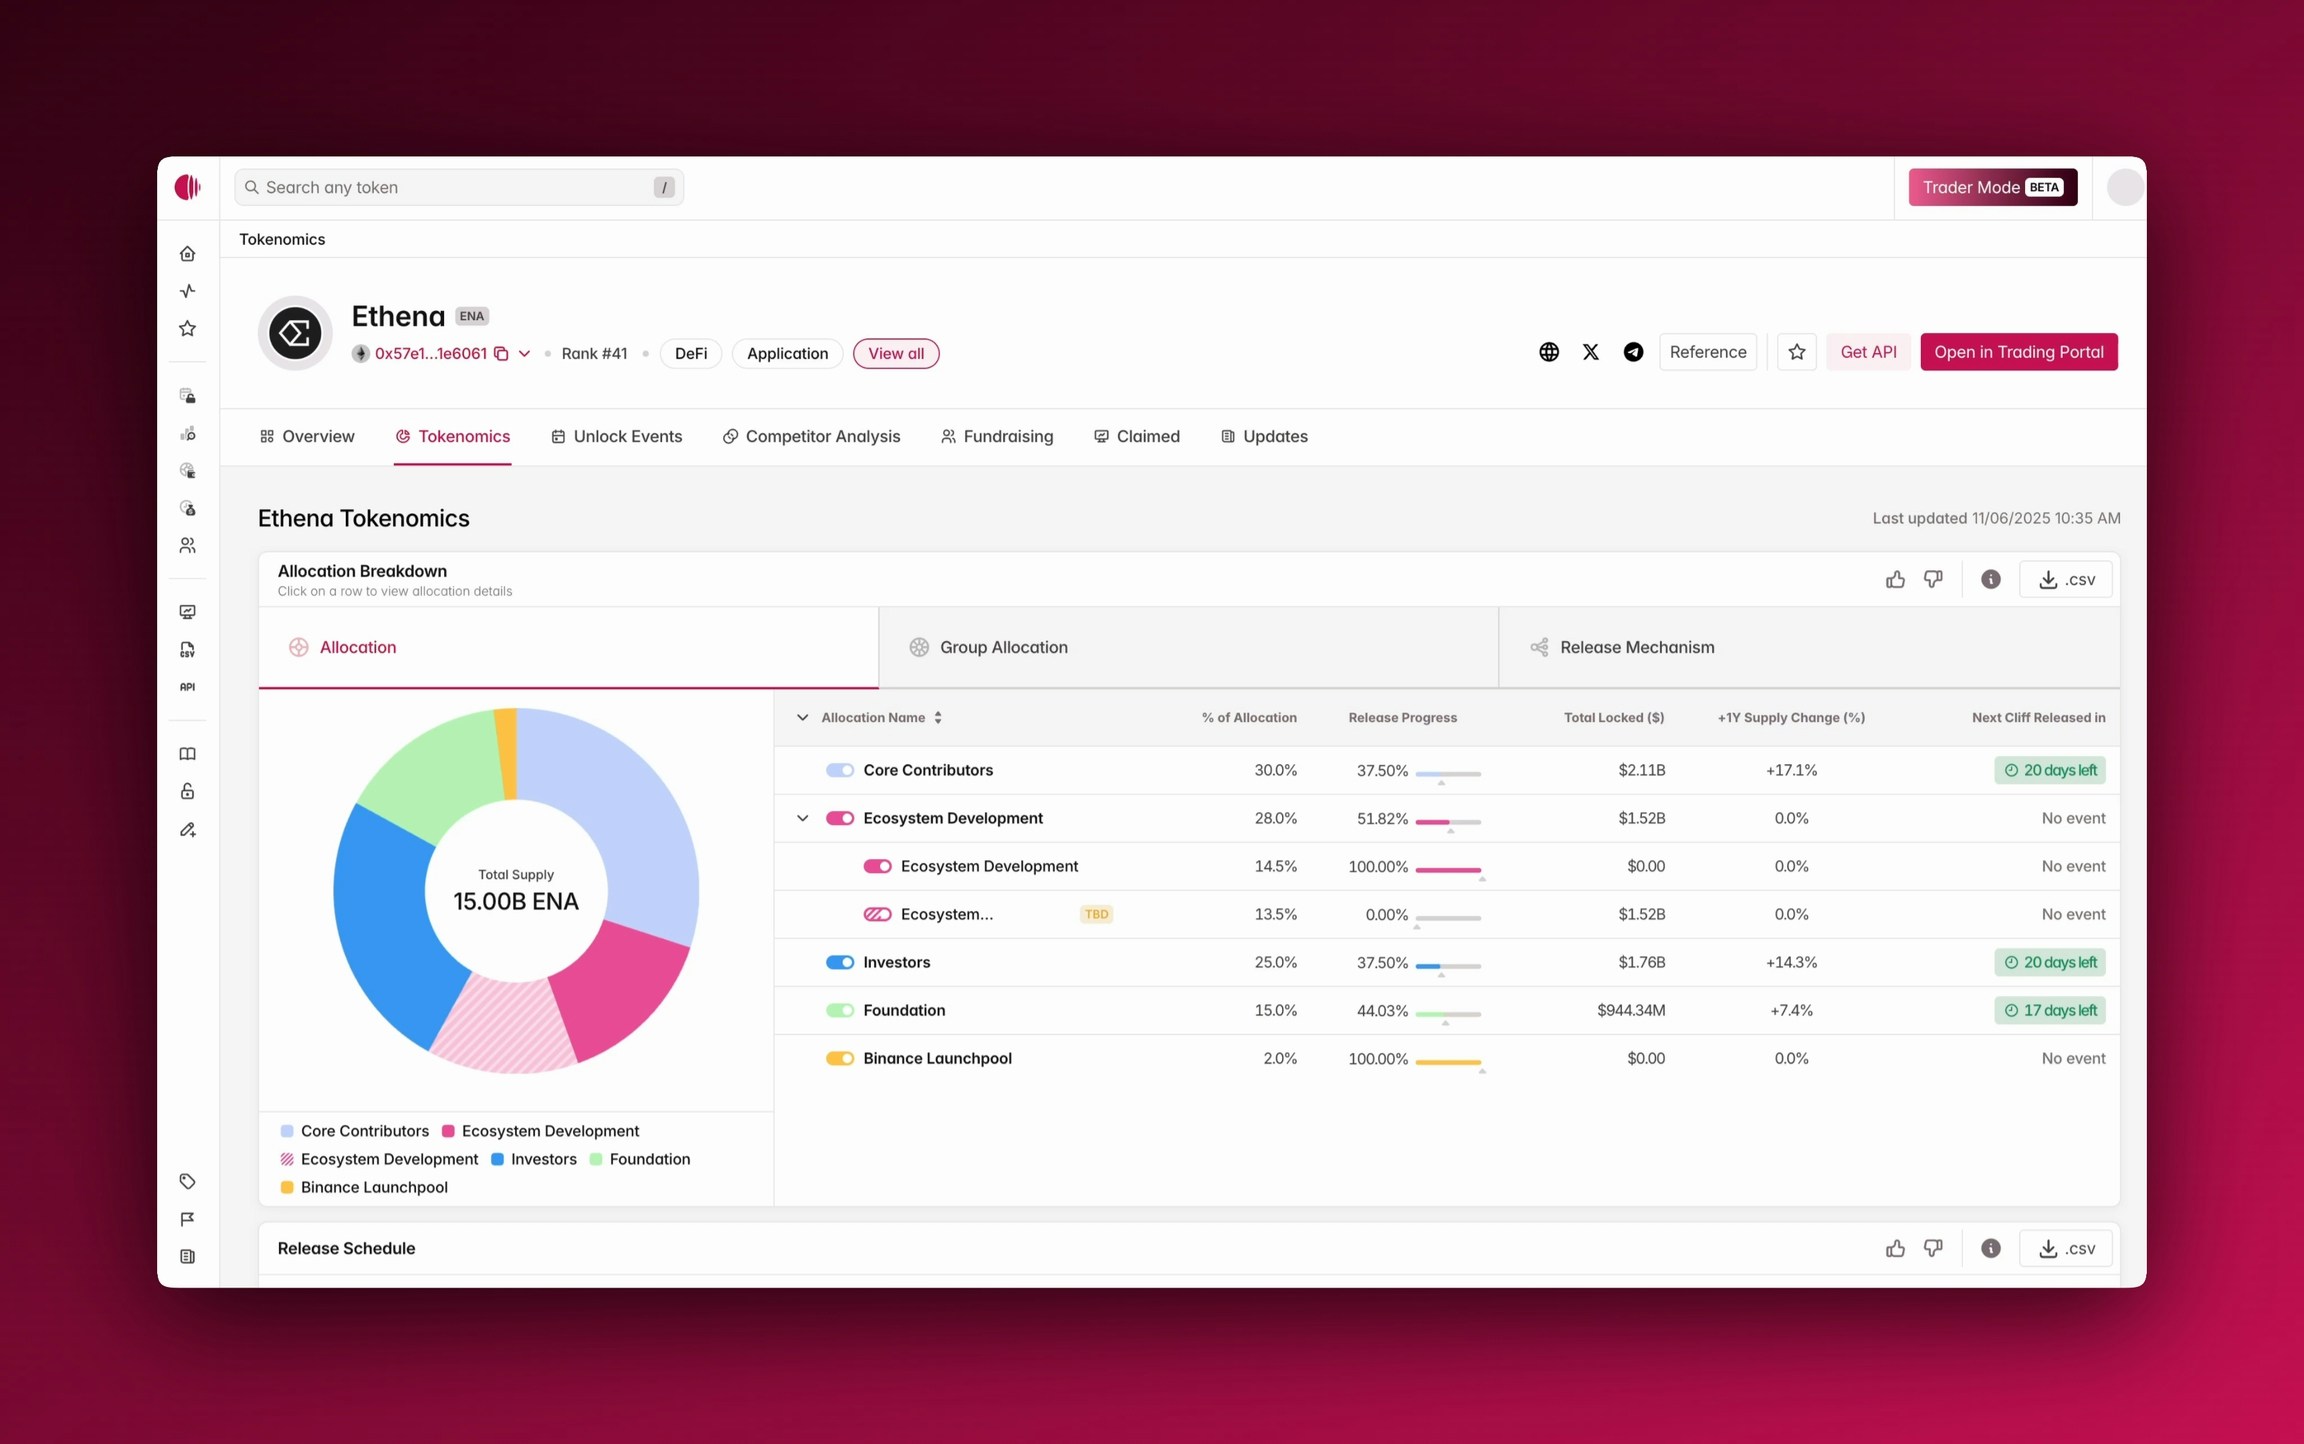
Access
You can access the Tokenomics pane directly from a project’s token page. Once inside, you’ll find three main tabs at the top:- Allocation: a breakdown of each allocation, including progress, unreleased amounts, and upcoming cliffs.
- Group Allocation: the standard allocations view, showing a breakdown of allocations into Tokenomist’s Standard Allocations.
- Release Mechanism: a classification of the methods through which supply is distributed.
Features
Allocation table
This chart highlights the token allocation and release status for the project’s total supply. Its purpose is to help you understand who owns the tokens, how much is locked vs released, and where future inflation may come from. Clicking on the element will show precision and assumption of an allocation.Using Allocation table
- View by:
- Allocation: the view represents the original, unprocessed allocation data as collected from official sources.
- Group Allocation: the view categorizes allocations into six standardized groups to facilitate easier interpretation and cross-project comparison.
- Release Mechanism: the view shows the mechanisms through which tokens are allocated to various stakeholders in an ecosystem.
Release schedule
A release schedule is a predetermined timeline that specifies exactly when and how many tokens will be distributed into circulation in the market.Using Release Schedule
- Display: Cumulative / Non-cumulative
- View by: 7D / 1M / 1Y / All
- View by: D / W / M
Where to next
- Explore more about our token page features: overview, unlock events, competitor analysis, claimed, fundraising, buyback, burn, and updates.
- Visit ETH’s Tokenomics.