
This feature is only available to Pro users.
Overview
The Buyback section tracks when a project repurchases its own tokens from the market. This is typically done to reduce circulating supply, stabilize price, or return value to token holders. Consistent buybacks often signal confidence in the project or a disciplined supply control policy, while also removing tokens from circulation to potentially support price stability. Tokenomist aggregates on-chain and reported buyback data to show how much has been repurchased, how much was spent, and the resulting impact on token supply.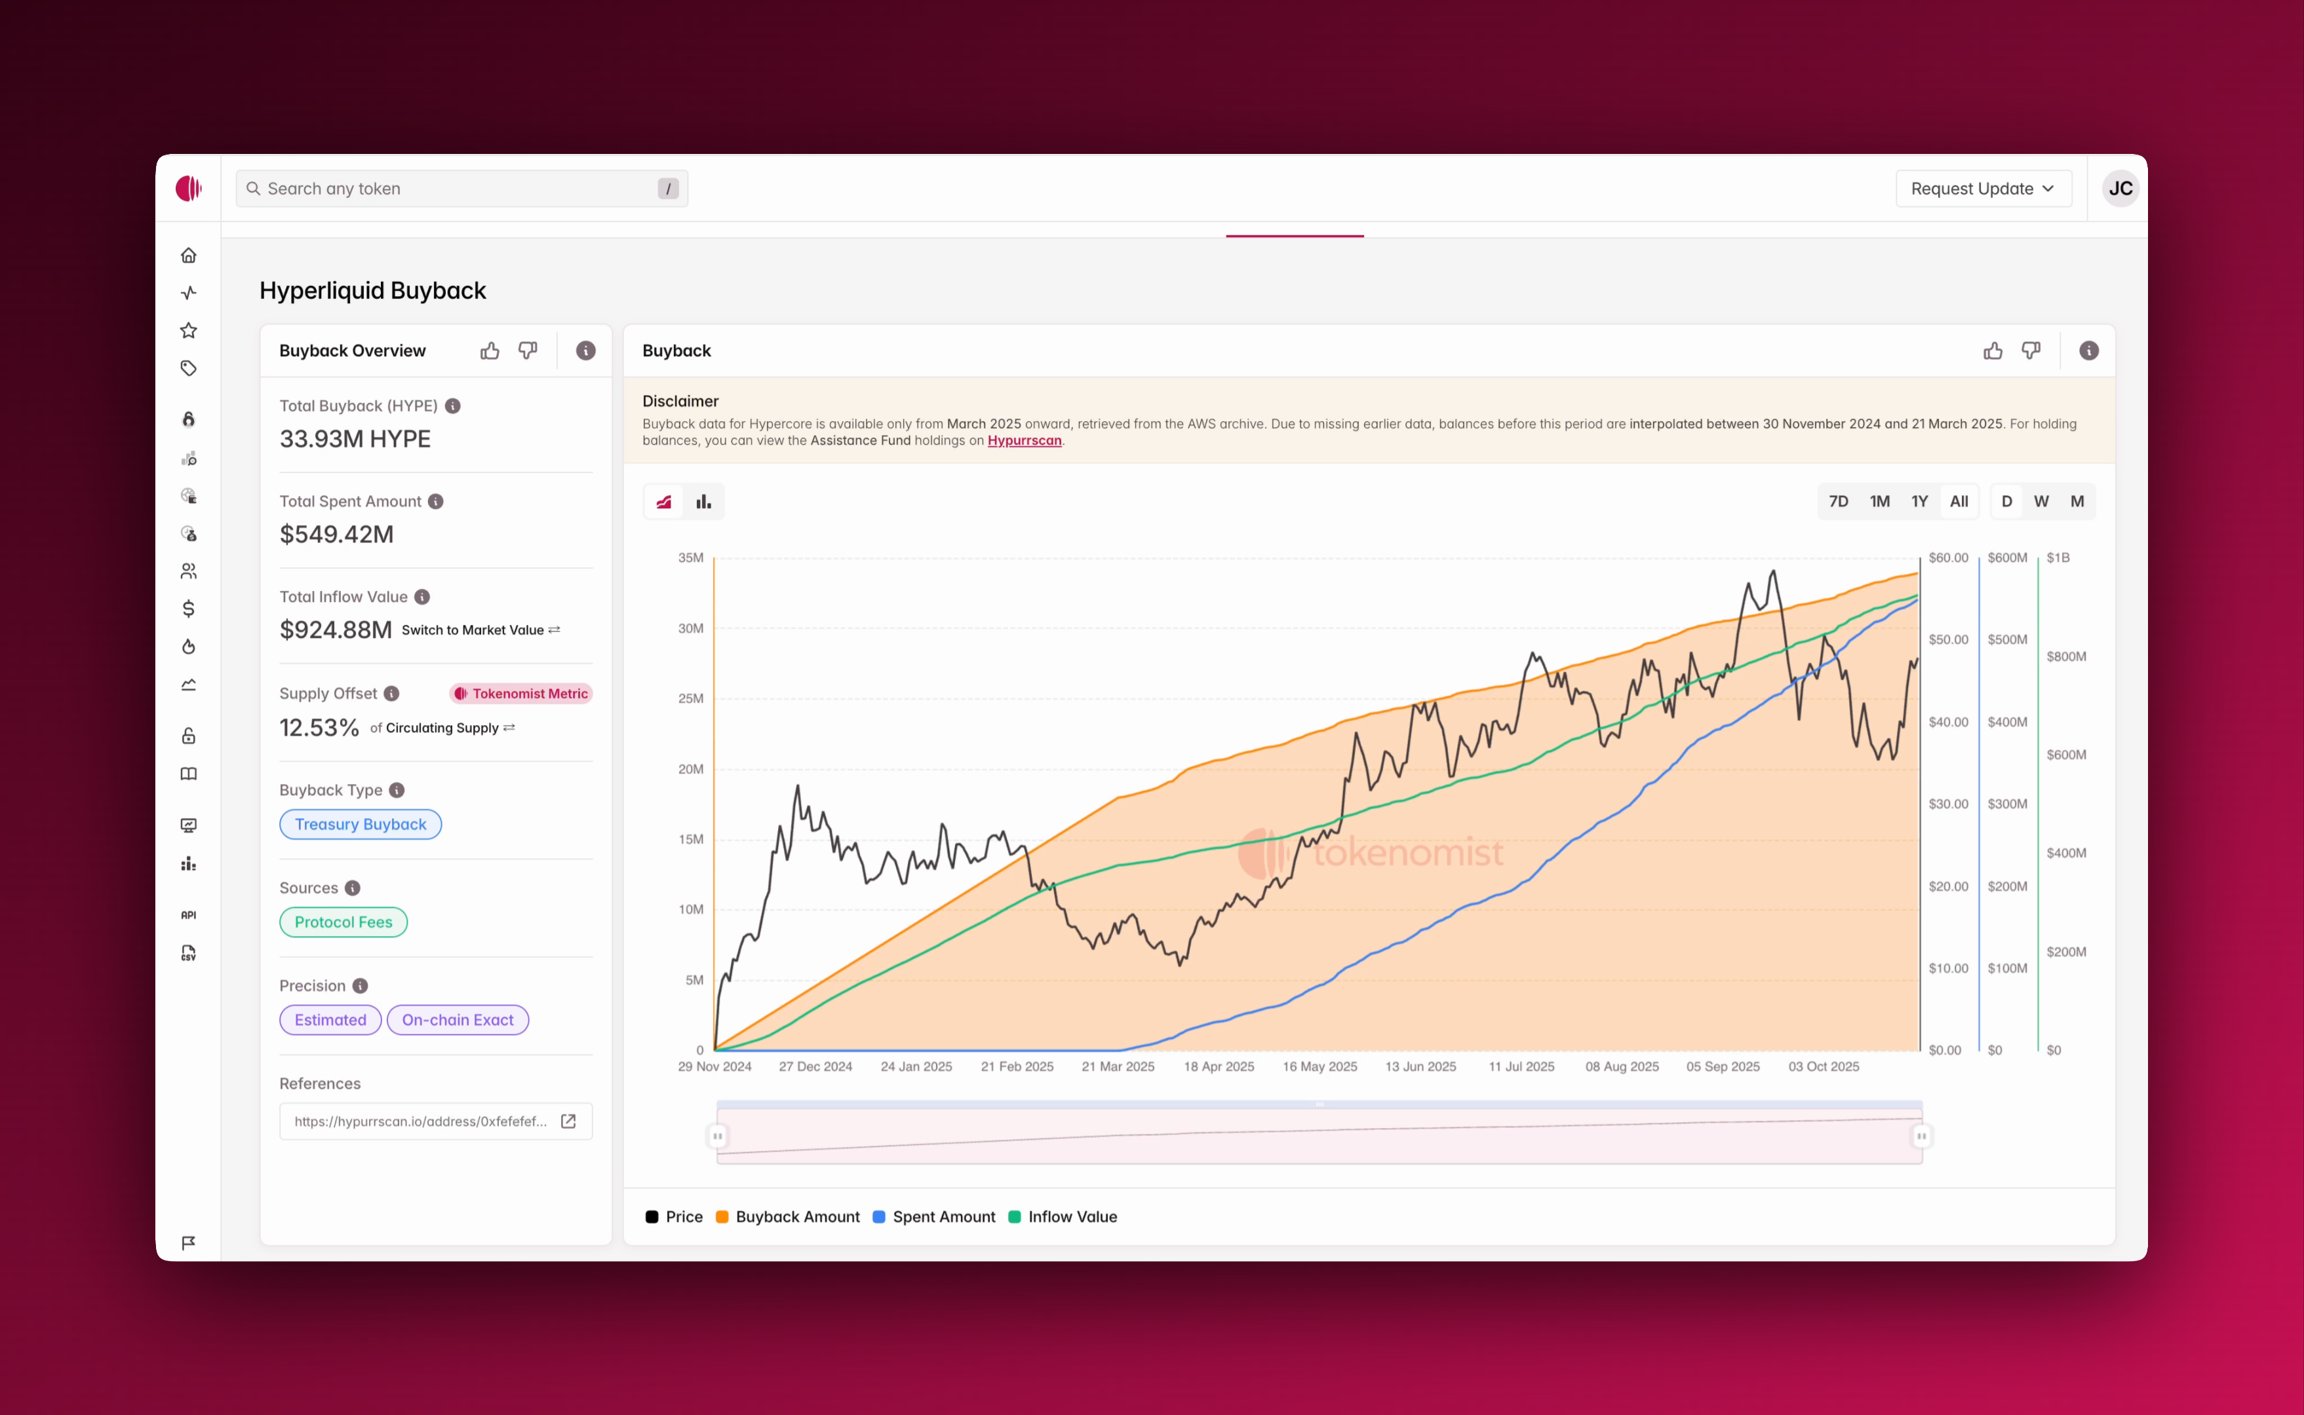
Access
You can find the Buyback section directly on a token’s page. It includes:- A summary panel showing total tokens repurchased, total amount spent (USD), and total value (USD).
- An interactive chart visualizing buyback activity over time.
- A table of latest buyback events, detailing amounts, transaction costs, and recipient addresses.
Features
Using Buyback
The Buyback Overview summarizes the key metrics at a glance:- Total Buyback: The total number of tokens bought back to date.
- Total Spent Amount: The actual capital deployed by the project to repurchase tokens. When on-chain transactions linked to buyer addresses are known, we are able to compute this value.
- Total Inflow Value: The historical value of tokens repurchased (amount × price at the time of inflow into a buyback wallet).
- Current Market Value: Can be toggled from Total Inflow Value to see the current market value of tokens bought back to date.
- Supply Offset (%): The percentage that total buyback is of circulating or released supply.
- Types / Sources / Precision: The categorization of buyback type and where the funds to execute buybacks were sourced from, as well as how precise our data is.
Buyback chart
Below the overview, the Buyback Chart visualizes activity over time. You can toggle between:- Buyback Amount, Spent Amount, Value, and Price metrics
- Cumulative or Non-Cumulative chart views
- Timeframes of 7D, 1M, 1Y, or All
Latest Buybacks Table
The Buyback Table lists the 10 most recent buyback events, aggregated daily, with details including date, token amount, USD spent, calculated value, and target address.
Learn more about buyback type, buyback source, buyback precision and Spent Amount vs Inflow Value Here.
FAQs
Where to next
- Explore more about our token page features: overview, tokenomics, unlock events, competitor analysis, claimed, fundraising, burn, and updates.
- Visit AAVE’s Buyback.