

This feature is only available to Pro users.
Overview
The Burn Page provides an in-depth view of a project’s token burn activity. Burns directly impact token scarcity and supply dynamics, so this page captures every confirmed burn event and aggregates total value, supply offset, and underlying rationale — giving a clear picture of whether a project’s deflationary design is structural, sustained, or symbolic.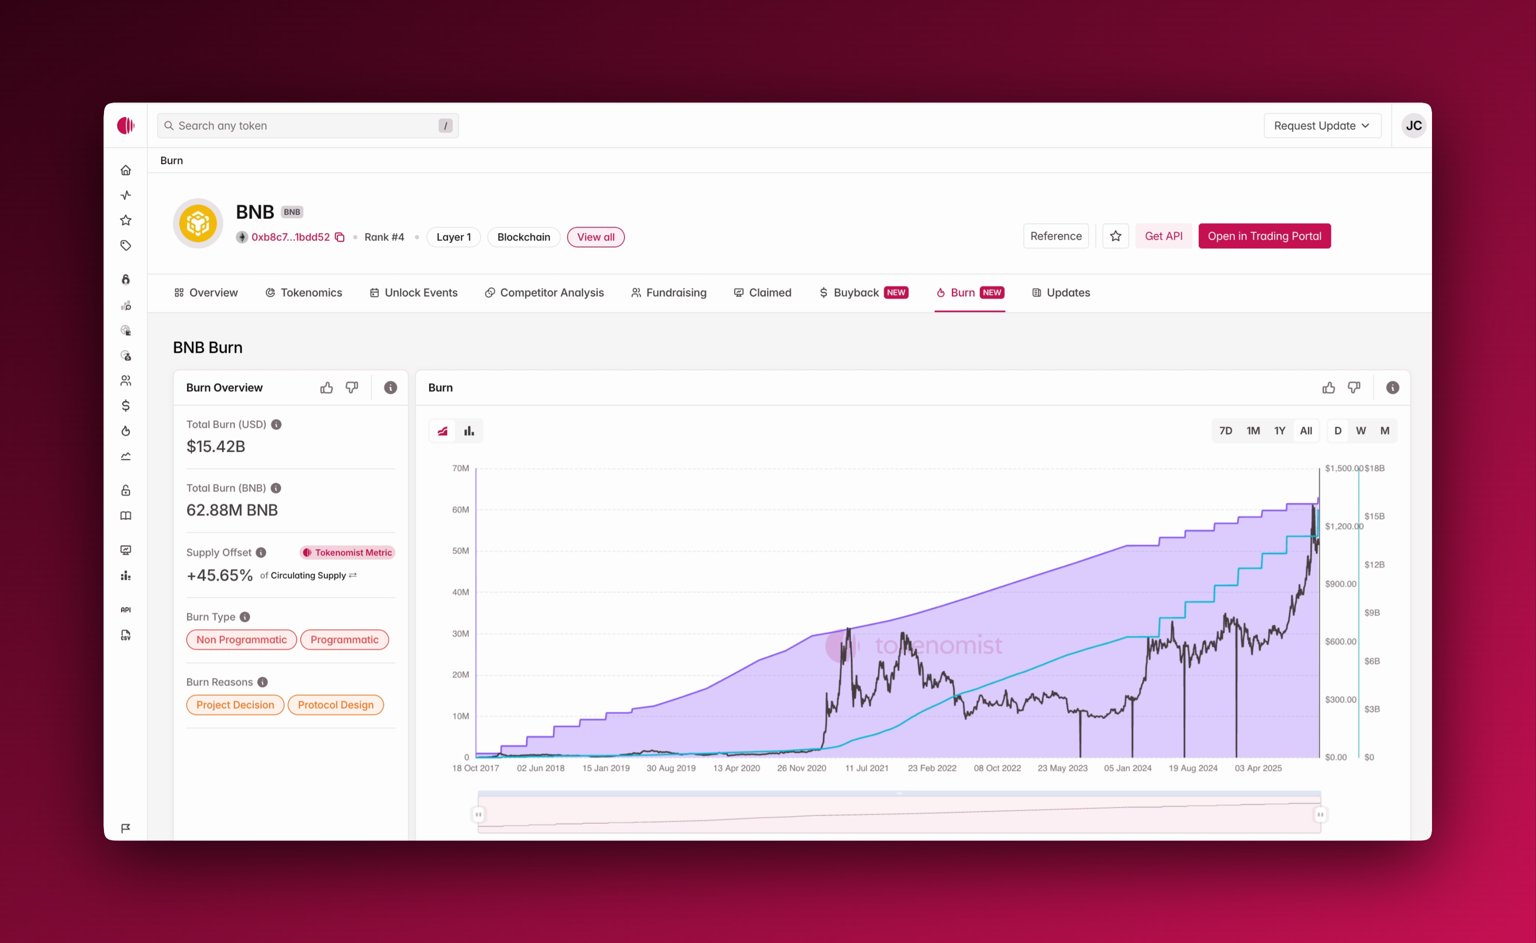
Access
You can access the Burn Page by selecting any token from the Burn Screener or directly from its project profile. Each Burn Page includes a summary panel, a historical chart, and a burn event table.Features
Using Burn
On the left you’ll see an overview summary of the burn information:- Total Burn (USD): Total value of tokens burned across all burn events, denominated in USD.
- Total Burn (Token): Total number of tokens permanently removed from supply.
- Supply Offset: The percentage of circulating (or released) supply offset by cumulative burns.
- Burn Type: Classification of the burn mechanism type and methodology.
- Burn Reasons: The primary rationale or purpose behind burn events.
- Date: Timestamp of the burn event.
- Burn Value (USD): USD value of tokens burned.
- Burn Amount (Token): Quantity of tokens removed.
- Burn Type: Mechanism classification.
- Burn Reason: Context for the burn.
- Source / Transaction: Link to the originating on-chain transaction or record.
Burn Types
Burn Reasons
Where to next
- Explore more about our token page features: overview, tokenomics, unlock events, competitor analysis, claimed, fundraising, buyback, and updates.
- Visit ASTER’s Burn.