
This feature is only available to Pro users.
Overview
Allocation Screener gives you a market-wide, tabular overview of how projects allocate their tokens. Instead of analyzing one project at a time, you can scan the entire market and compare the structure of projects at scale — two projects may have the same emissions outlook, but if one is dominated by private investors while another leans heavily toward community, the long-term incentives and risks look very different. All data is standardized through Tokenomist’s standard allocations framework.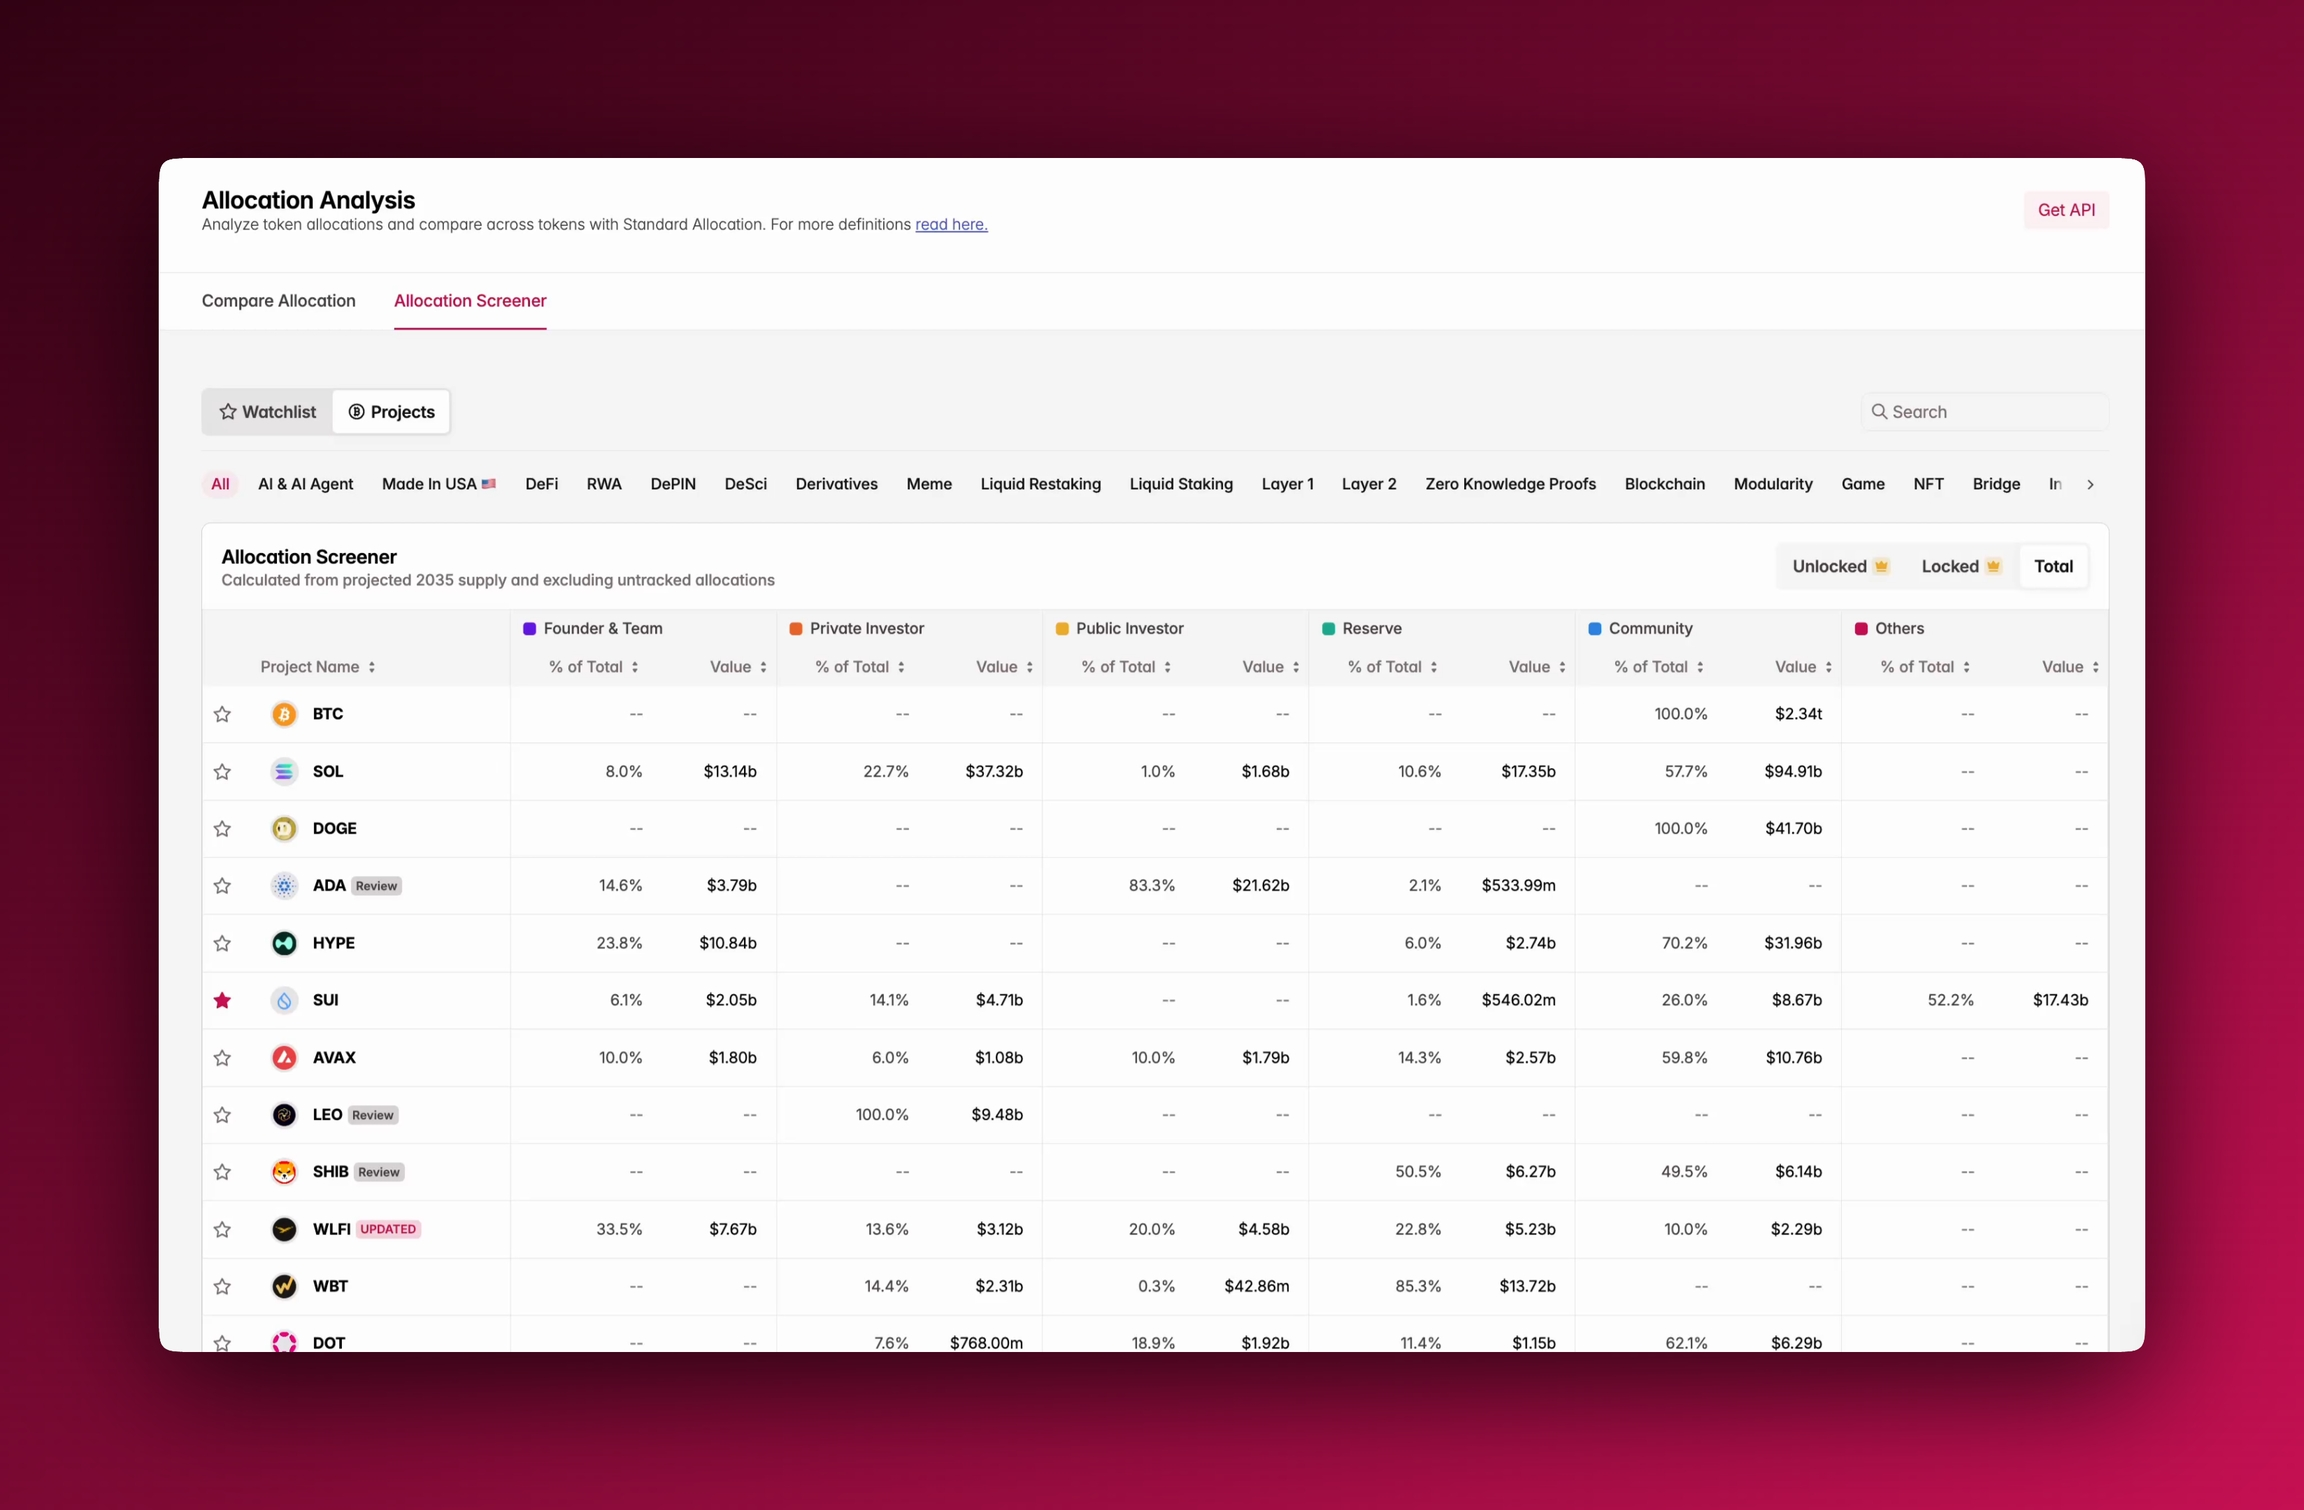
Accessing Allocation Screener
You’ll find Allocation Screener under the Allocation tab, next to Compare Allocation, or through the sidebar. It opens by default in Total supply view, but you can switch to Unlocked or Locked .Using Allocation Screener
The table lists projects row by row, with allocation categories shown as columns. For each category, you’ll see both the percentage of total supply and the value in USD. Filters at the top allow you to narrow results by sector (AI, DeFi, L1, L2, etc.), and with Pro you can toggle between unlocked, locked, and total distributions. The table is sortable by percentage or value, and fully searchable.Where To Next?
- See our methodology for classifying allocations in group allocations.
- Check out supply metrics to learn more about definitions of terms like circulating and unlocked supply.
- Learn more about how to use compare allocation in parallel with Allocation Screener.