> ## Documentation Index
> Fetch the complete documentation index at: https://docs.tokenomist.ai/llms.txt
> Use this file to discover all available pages before exploring further.
# Overview Panel
> Supply details, release schedule, and the key assumptions behind our listing
# Overview
Each token tracked on Tokenomist has a dedicated page that consolidates **release schedules, allocations,** and **methodology** in one place. This shows you not only *when* tokens are released, but also *who benefits* and *how precise* the data is. By combining every aspect of supply analysis into one standardized view, the Token Page makes it easier to evaluate dilution risk, investor incentives, and long-term sustainability at a glance.
 # Access
The Token Page is available for every tracked asset in Tokenomist. You can access it by searching directly from the sidebar or top navigation, or by clicking into any token from features such as the [overview](https://tokenomist.ai/overview), [token unlocks](https://tokenomist.ai/), [emission screener](https://tokenomist.ai/emission/screener), [allocation screener](https://tokenomist.ai/allocation/screener), [on-chain claims](https://tokenomist.ai/onchain-claim), [fundraising](https://tokenomist.ai/fundraising/screener), [buyback screener](https://tokenomist.ai/buyback/screener), or [burn screener](https://tokenomist.ai/burn/screener).
Tabs on a token page appear conditionally based on available data. Not every token will show all tabs (e.g., Burn, Buyback, Fundraising, or Claimed may not appear if no data exists for that token). Recently added tabs may display a **(NEW)** badge.
Each Token Page is organized into the following modules:
1. **Emission**: Net supply changes (cliff, linear, inflation, deflation). See [Precision and Assumption](/precision-and-assumption) for how we categorize releases into cliff unlocks or linear releases.
2. **Unlock Progress & Notable Events**: A snapshot of total released supply and upcoming cliff unlocks.
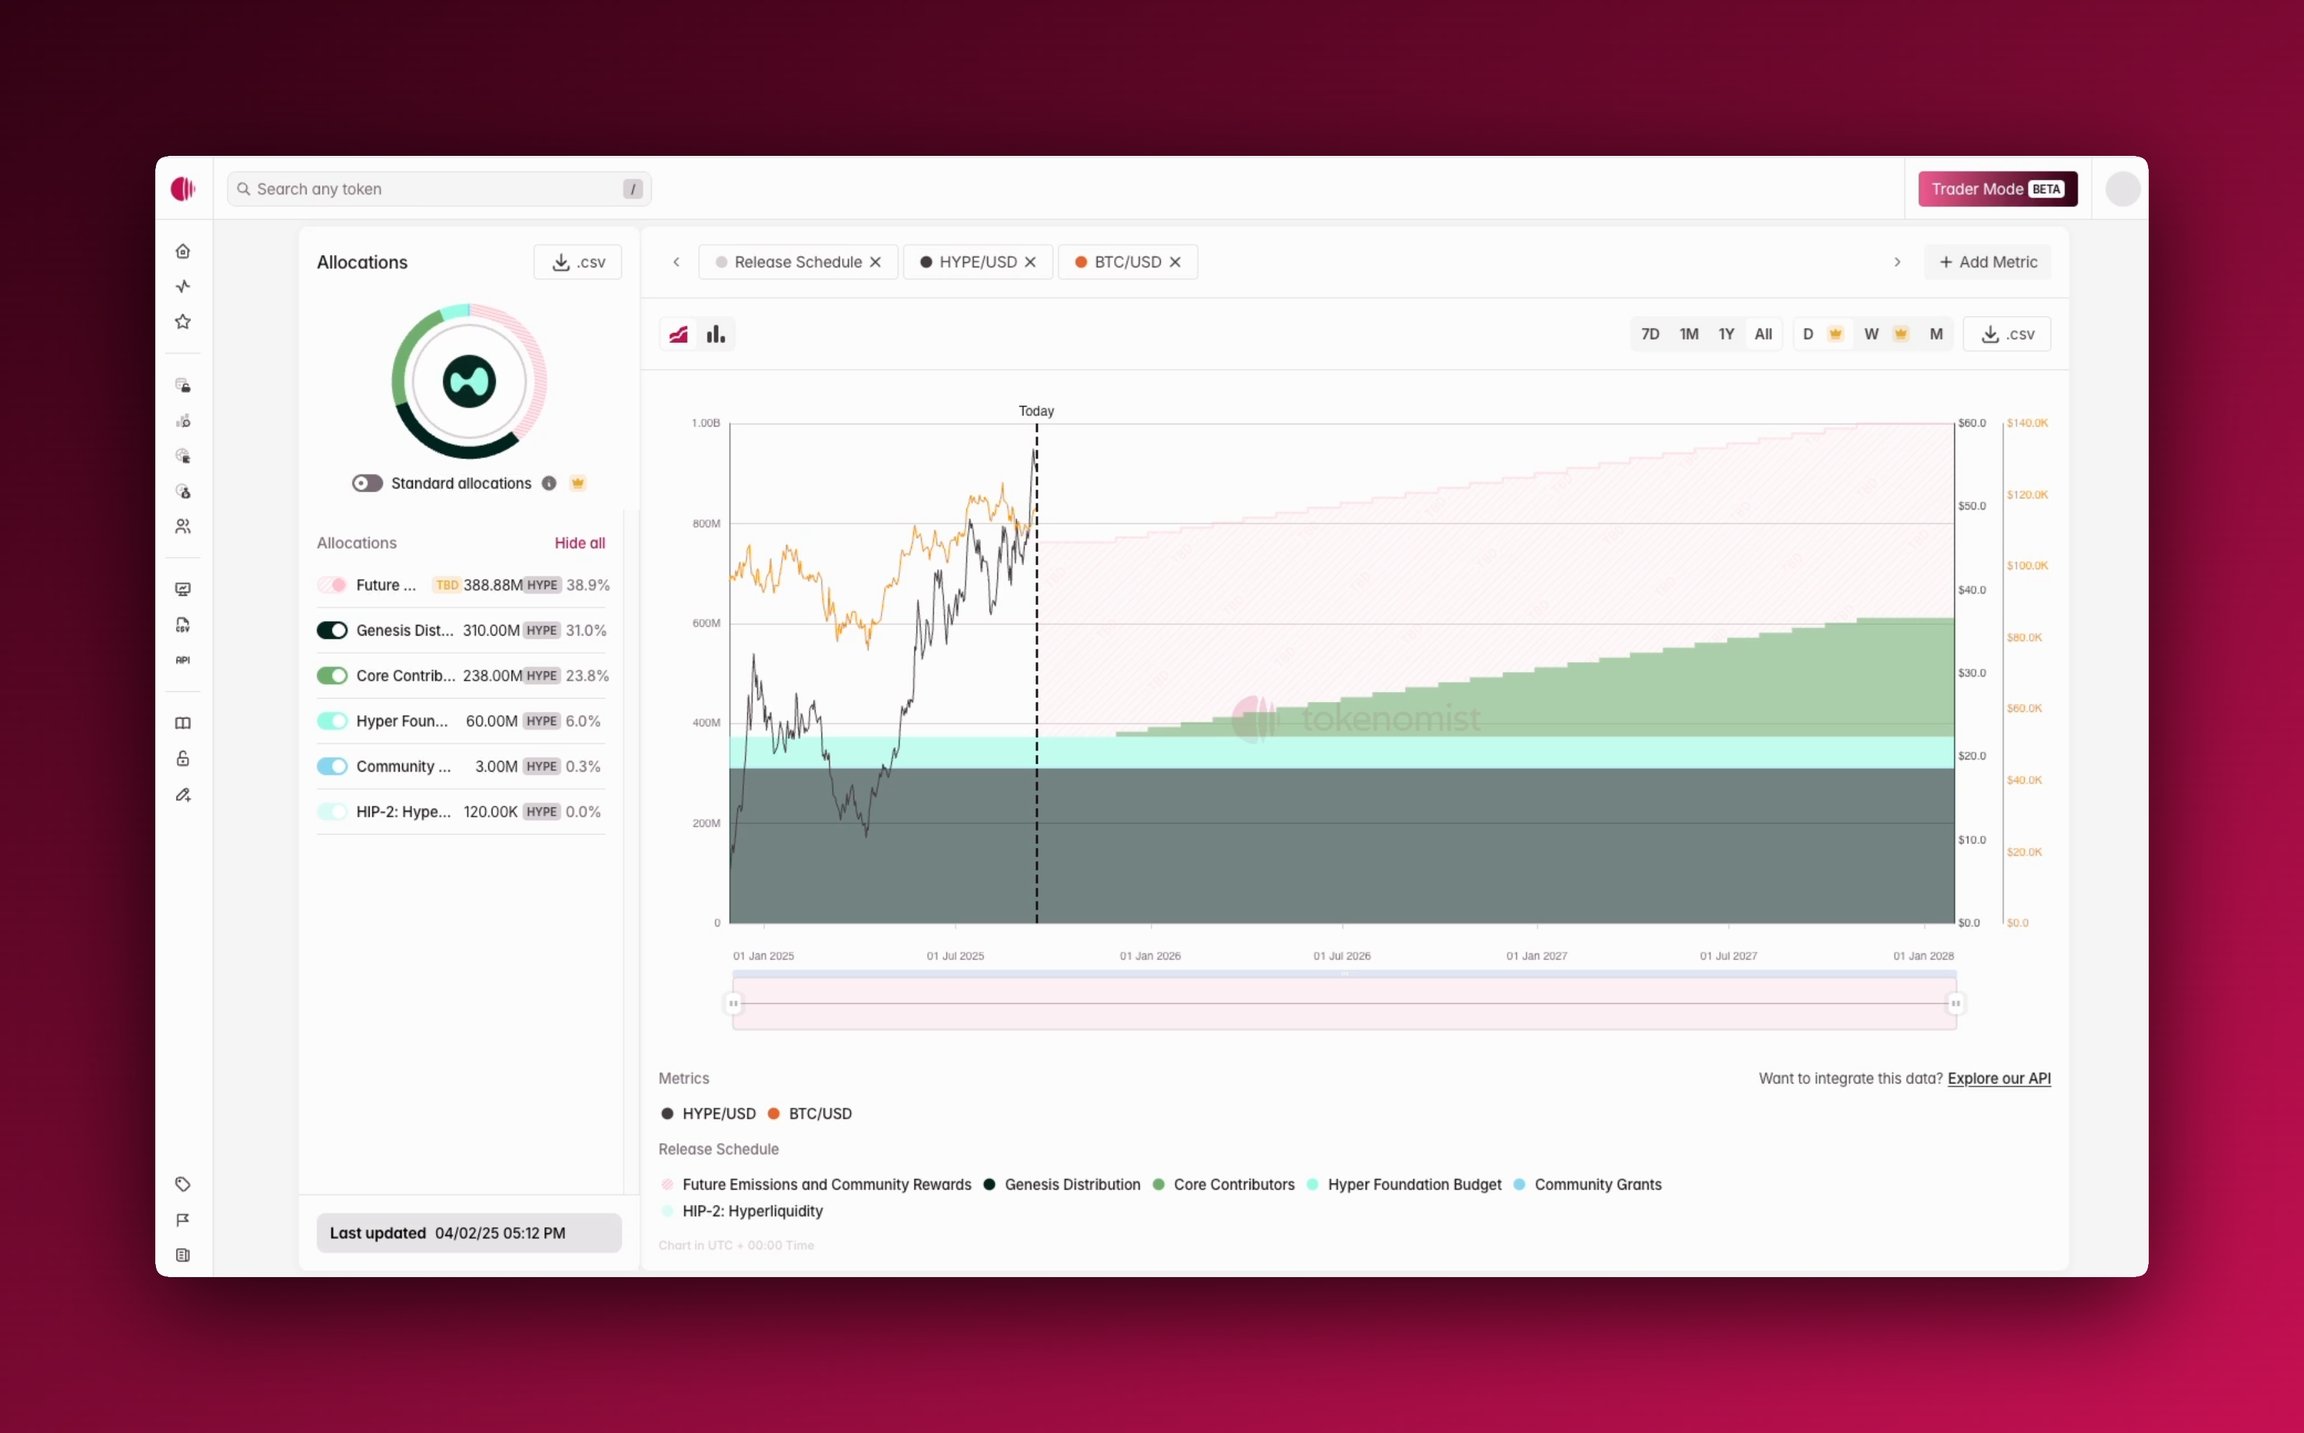
3. **Release Schedule**: An interactive token release chart with allocation toggles and metric overlays.
4. **Tokenomics Reference**: Source reliability via [Precision and Assumption](/precision-and-assumption).
# Features
## Highlight bar
This panel gives a quick overview of a specific crypto token, showing its basic identity, market status, and key tokenomics signals at a glance.
| Metric | Description | Formula |
| ------------ | -------------------------------------------------------------------------------------------------------------------------------------------------------------------------------------------------------------------------------------------------- | ----------------------------- |
| Project name | A project's full name, followed by its token ticker and its symbol. | |
| Listed by | The methods that a project is listed. | |
| Rank | Ranked by reported market cap, provided by [CoinGecko](https://www.coingecko.com/). | |
| Sector | Sectors that a token is categorized. | |
| Price | Market price of a token, provided by [CoinGecko](https://www.coingecko.com/). | |
| Burn | Percentage of released supply offset by burn activities. | |
| Buyback | Percentage of released supply offset by buyback activities. | |
| Dynamic | Allocations have variable emission rates that change according to the protocol's design parameters. Historical data reflects the actual tokens emitted under this allocation, while future values are projected based on historical emission data. | |
| Claim | Net USD amount claimers received from vesting addresses. | Total claimed × Current price |
| Raise amount | Aggregated capital from all funding rounds (private and public) that represents total investor commitment across all project stages. | |
| Version | The data version/revision number for this token's tokenomics data. | |
| Updated | The date when this token's tokenomics data was last updated. | |
## Fundamentals
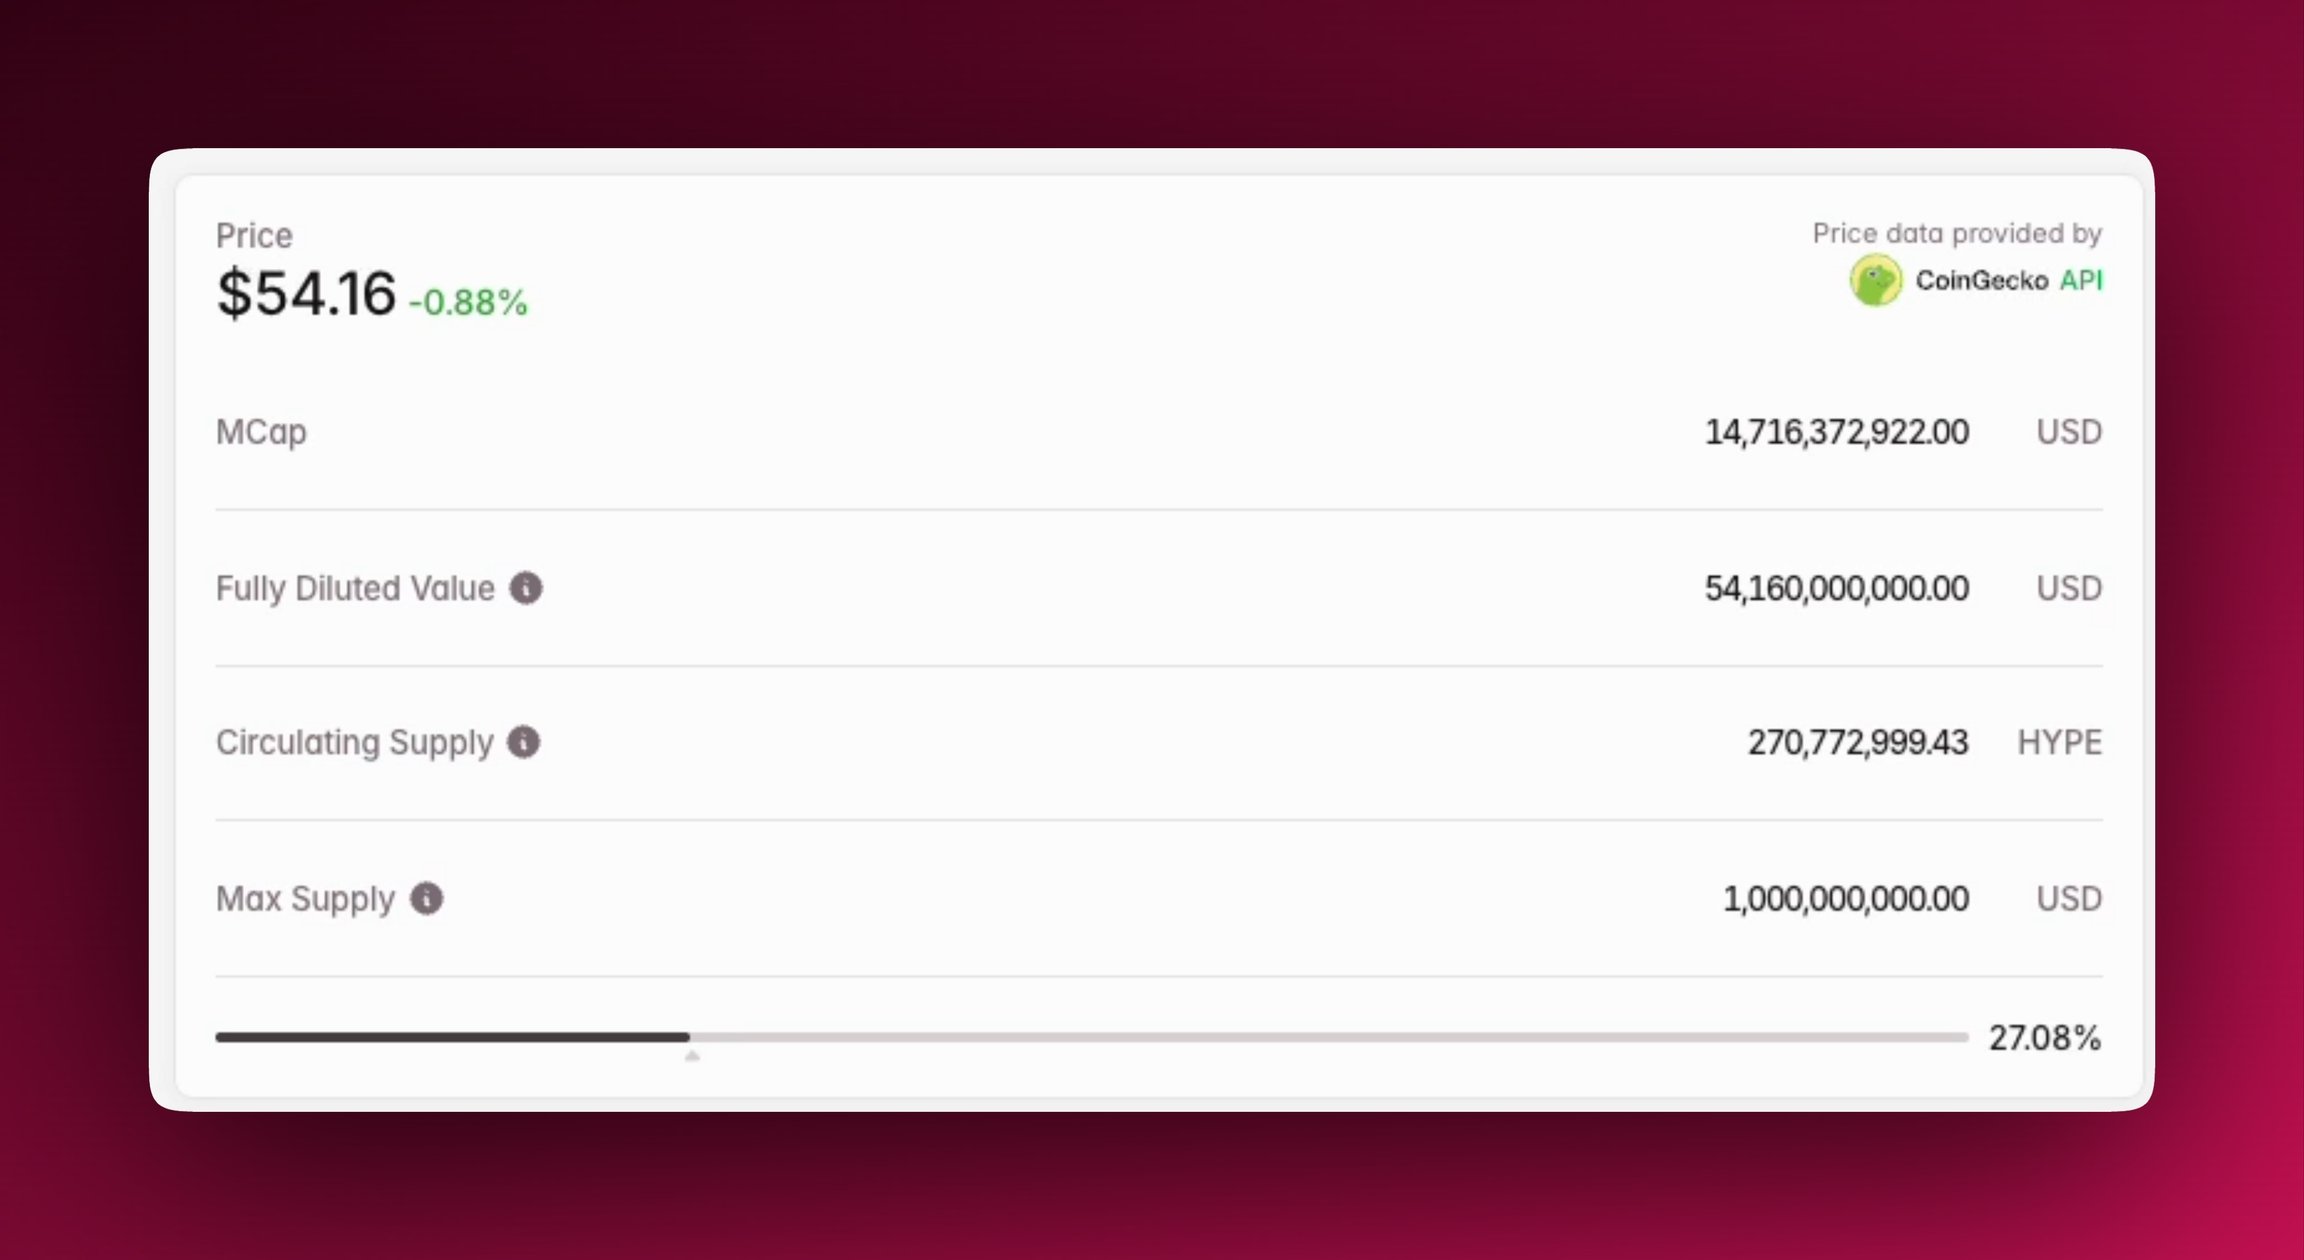
This table summarizes the core market valuation and supply fundamentals of a crypto token that helps you understand how the token is valued today vs its potential value when all tokens are released.
### Using Fundamentals
* View by: USD / Token Amount
| Metric | Description | Formula |
| -------------------------- | --------------------------------------------------------------------------------------------------------------------------------------------------------------------------------------------------------------------------------------------------------------- | --------------------------------------------------------------------------------------------------------------------------------- |
| Reported market cap | The number of tokens currently available and actively trading in the public market, reported by [CoinGecko](https://www.coingecko.com/). | |
| Adjusted market cap (MCAP) | The total value of a cryptocurrency's released supply excluding permanently burned tokens. This metric may differ from reported market cap, as it includes tokens that are available but may still be held in stakeholder wallets. This is a Tokenomist Metric. | Current Price × Released Supply exclude burned |
| Fully diluted value (FDV) | The theoretical total market value of a cryptocurrency assuming all possible tokens are in circulation. This is a Tokenomist Metric. | Limited supply tokens: Maximum Supply × Current Price
# Access
The Token Page is available for every tracked asset in Tokenomist. You can access it by searching directly from the sidebar or top navigation, or by clicking into any token from features such as the [overview](https://tokenomist.ai/overview), [token unlocks](https://tokenomist.ai/), [emission screener](https://tokenomist.ai/emission/screener), [allocation screener](https://tokenomist.ai/allocation/screener), [on-chain claims](https://tokenomist.ai/onchain-claim), [fundraising](https://tokenomist.ai/fundraising/screener), [buyback screener](https://tokenomist.ai/buyback/screener), or [burn screener](https://tokenomist.ai/burn/screener).
Tabs on a token page appear conditionally based on available data. Not every token will show all tabs (e.g., Burn, Buyback, Fundraising, or Claimed may not appear if no data exists for that token). Recently added tabs may display a **(NEW)** badge.
Each Token Page is organized into the following modules:
1. **Emission**: Net supply changes (cliff, linear, inflation, deflation). See [Precision and Assumption](/precision-and-assumption) for how we categorize releases into cliff unlocks or linear releases.
2. **Unlock Progress & Notable Events**: A snapshot of total released supply and upcoming cliff unlocks.
3. **Release Schedule**: An interactive token release chart with allocation toggles and metric overlays.
4. **Tokenomics Reference**: Source reliability via [Precision and Assumption](/precision-and-assumption).
# Features
## Highlight bar
This panel gives a quick overview of a specific crypto token, showing its basic identity, market status, and key tokenomics signals at a glance.
| Metric | Description | Formula |
| ------------ | -------------------------------------------------------------------------------------------------------------------------------------------------------------------------------------------------------------------------------------------------- | ----------------------------- |
| Project name | A project's full name, followed by its token ticker and its symbol. | |
| Listed by | The methods that a project is listed. | |
| Rank | Ranked by reported market cap, provided by [CoinGecko](https://www.coingecko.com/). | |
| Sector | Sectors that a token is categorized. | |
| Price | Market price of a token, provided by [CoinGecko](https://www.coingecko.com/). | |
| Burn | Percentage of released supply offset by burn activities. | |
| Buyback | Percentage of released supply offset by buyback activities. | |
| Dynamic | Allocations have variable emission rates that change according to the protocol's design parameters. Historical data reflects the actual tokens emitted under this allocation, while future values are projected based on historical emission data. | |
| Claim | Net USD amount claimers received from vesting addresses. | Total claimed × Current price |
| Raise amount | Aggregated capital from all funding rounds (private and public) that represents total investor commitment across all project stages. | |
| Version | The data version/revision number for this token's tokenomics data. | |
| Updated | The date when this token's tokenomics data was last updated. | |
## Fundamentals
This table summarizes the core market valuation and supply fundamentals of a crypto token that helps you understand how the token is valued today vs its potential value when all tokens are released.
### Using Fundamentals
* View by: USD / Token Amount
| Metric | Description | Formula |
| -------------------------- | --------------------------------------------------------------------------------------------------------------------------------------------------------------------------------------------------------------------------------------------------------------- | --------------------------------------------------------------------------------------------------------------------------------- |
| Reported market cap | The number of tokens currently available and actively trading in the public market, reported by [CoinGecko](https://www.coingecko.com/). | |
| Adjusted market cap (MCAP) | The total value of a cryptocurrency's released supply excluding permanently burned tokens. This metric may differ from reported market cap, as it includes tokens that are available but may still be held in stakeholder wallets. This is a Tokenomist Metric. | Current Price × Released Supply exclude burned |
| Fully diluted value (FDV) | The theoretical total market value of a cryptocurrency assuming all possible tokens are in circulation. This is a Tokenomist Metric. | Limited supply tokens: Maximum Supply × Current Price
Unlimited supply tokens: Projected Supply at Year 2035 × Current Price |
| Float % | The percentage of tradable supply currently in circulation, excluding burned tokens. | Limited supply tokens: Released supply ÷ max supply (both net of burns)
Unlimited supply tokens: Y2035 projections |
 ## Released progress
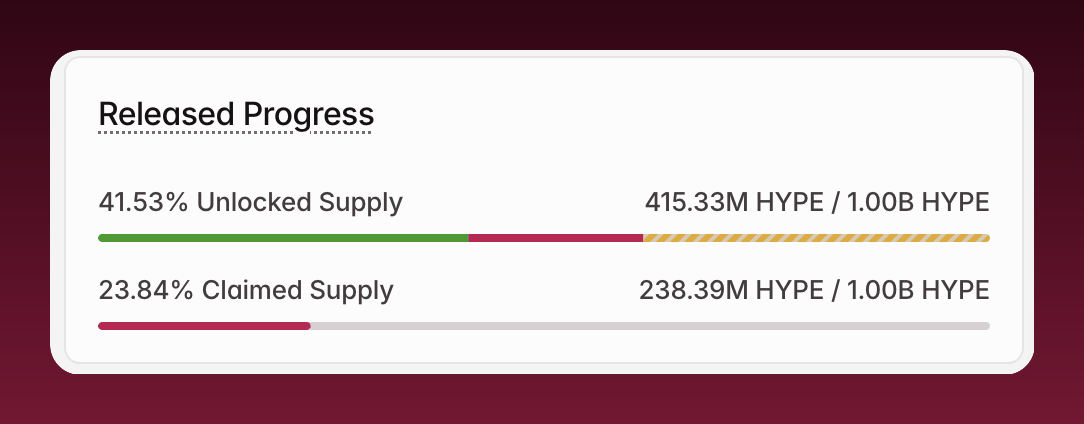
This panel presents how much of a token's total supply has already been released into circulation and how much remains locked, which helps you understand token maturity and future dilution risk. Hovering your mouse over the element will show released, unreleased, TBD locked, and untracked token amount and percentage of total supply.
| Metric | Description | Formula |
| ----------------- | --------------------------------------------------------------------------------------------------------------------------------------------------------------------- | ---------------------------------------- |
| Released progress | Percentage of the total release schedule that has completed, including burned tokens. Reaches 100% when all scheduled unlocks finish, regardless of subsequent burns. | Tokens released ÷ total planned releases |
For tokens with unlock lifecycle tracking (currently [Hyperliquid](https://tokenomist.ai/hyperliquid)), the Released Progress panel includes additional rows:
| Metric | Description | Formula |
| ----------------- | -------------------------------------------------------------------------------------------------------------------------------------------------------------------------------------------------------------- | ------------------------------------------------------- |
| Claimed Supply | The burn-adjusted amount that has actually been claimed on-chain, shown as a percentage and absolute value. A warning icon appears when there is a significant gap between Unlocked Supply and Claimed Supply. | Claimed Supply (burn-adjusted) ÷ Total Claimable Supply |
| Disclaimers badge | Shows the count of data disclaimers for transparency (e.g., "2 Disclaimers"), displayed at the top-right of the Released Progress panel. | |
## Released progress
This panel presents how much of a token's total supply has already been released into circulation and how much remains locked, which helps you understand token maturity and future dilution risk. Hovering your mouse over the element will show released, unreleased, TBD locked, and untracked token amount and percentage of total supply.
| Metric | Description | Formula |
| ----------------- | --------------------------------------------------------------------------------------------------------------------------------------------------------------------- | ---------------------------------------- |
| Released progress | Percentage of the total release schedule that has completed, including burned tokens. Reaches 100% when all scheduled unlocks finish, regardless of subsequent burns. | Tokens released ÷ total planned releases |
For tokens with unlock lifecycle tracking (currently [Hyperliquid](https://tokenomist.ai/hyperliquid)), the Released Progress panel includes additional rows:
| Metric | Description | Formula |
| ----------------- | -------------------------------------------------------------------------------------------------------------------------------------------------------------------------------------------------------------- | ------------------------------------------------------- |
| Claimed Supply | The burn-adjusted amount that has actually been claimed on-chain, shown as a percentage and absolute value. A warning icon appears when there is a significant gap between Unlocked Supply and Claimed Supply. | Claimed Supply (burn-adjusted) ÷ Total Claimable Supply |
| Disclaimers badge | Shows the count of data disclaimers for transparency (e.g., "2 Disclaimers"), displayed at the top-right of the Released Progress panel. | |
 ## Upcoming unlocks
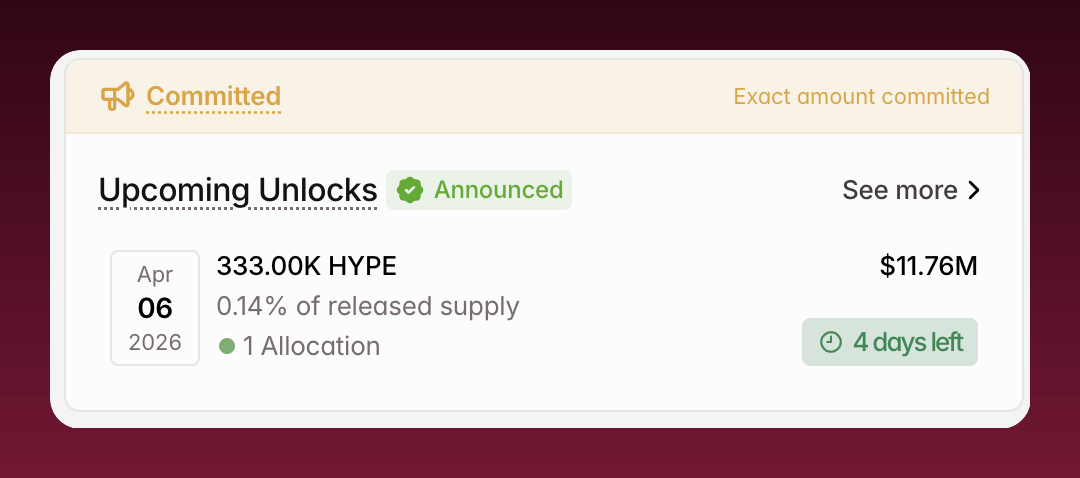
This panel highlights the next major token unlock event for the project. It provides understanding on how much new supply will enter the market, when it will happen, and how large the impact could be. Hovering your mouse over the element will show type of unlock, allocations, unlocked amount in token, USD, and percentage of released supply of that upcoming unlock event.
For tokens with unlock lifecycle tracking (currently [Hyperliquid](https://tokenomist.ai/hyperliquid)), upcoming unlocks display a **status badge**:
| Status badge | Meaning |
| ------------ | ------------------------------------------------------------------------------------------------ |
| `Whitepaper` | The amount is based on the whitepaper schedule with a note: "Long-range estimate, may adjust" |
| `Committed` | The project team has announced the actual claim amount, providing higher confidence in the value |
When a Committed event is completed, the widget automatically rotates to show the next upcoming Whitepaper unlock.
## Upcoming unlocks
This panel highlights the next major token unlock event for the project. It provides understanding on how much new supply will enter the market, when it will happen, and how large the impact could be. Hovering your mouse over the element will show type of unlock, allocations, unlocked amount in token, USD, and percentage of released supply of that upcoming unlock event.
For tokens with unlock lifecycle tracking (currently [Hyperliquid](https://tokenomist.ai/hyperliquid)), upcoming unlocks display a **status badge**:
| Status badge | Meaning |
| ------------ | ------------------------------------------------------------------------------------------------ |
| `Whitepaper` | The amount is based on the whitepaper schedule with a note: "Long-range estimate, may adjust" |
| `Committed` | The project team has announced the actual claim amount, providing higher confidence in the value |
When a Committed event is completed, the widget automatically rotates to show the next upcoming Whitepaper unlock.
 ## Emission
This panel focuses on how many tokens have been emitted, or released into circulation, and where those tokens came from. This helps you understand the source of supply growth and token distribution dynamics. On type of unlock, hovering your mouse over the element will show type of unlock, allocations, and unlocked amount in token, USD, and percentage of released supply.
Beside that is the emission component, which standardizes all supply changes into:
* **Inflation**: all positive supply emission from cliff unlocks and linear releases.
* **Deflation**: all negative supply decreases from mechanisms such as burn.
* **Emission**: the difference between inflation and deflation in the timeframe.
### Using Emission
* View by: All / +1D / +7D / +1M / +6M / +1Y / +4Y
* Break down by:
* Group allocation
* Type of unlock:
* [Cliff unlock](/cliff-and-linear-emission): an unlock event that occurs at a set interval greater than one day (e.g., weekly, monthly, quarterly). This represents a discrete, periodic release of tokens.
* [Linear release](/cliff-and-linear-emission): a continuous, daily release of a specific number of tokens. This represents a smooth, predictable increase in the circulating supply.
By default, the timeframe is set to **All**, which is all **historical emissions**.
| Metric | Description |
| --------- | ------------------------------------------------------------------------------------------------------------------------------------------- |
| Deflation | Tokens permanently removed (burned) from circulation. This occurs through either pre-programmed events or manual burns by the project team. |
## Allocations
This table exhibits how the total token supply is allocated across different purposes and groups, offering understanding about who controls the tokens and how future supply will be distributed. Clicking on the element will show precision and assumption of an allocation.
### Using Allocations
* Toggle: Group allocations
| Metric | Description |
| --------------- | --------------------------------------------------------------------- |
| Allocation name | Name of the allocation as stated in data sources or group allocations |
| % of allocation | Percentage of total amount that is allocated to an allocation. |
| Total amount | The total amount of token that is allocated to an allocation. |
## Unlock Progress & Events
The unlock widget shows **total supply status**, i.e., how much of the token's supply is Released, TBD Locked, Unreleased, or Untracked.
To the right of that, the **Notable Cliff Unlocks** shows 1 upcoming cliff unlock events (or **All Historical & 2-year Future Unlock Events with Pro** in [unlock event](/unlock-events-pane)).
These components can be used to gauge the current status of token release progress and any important upcoming release events at a glance.
## Release Schedule
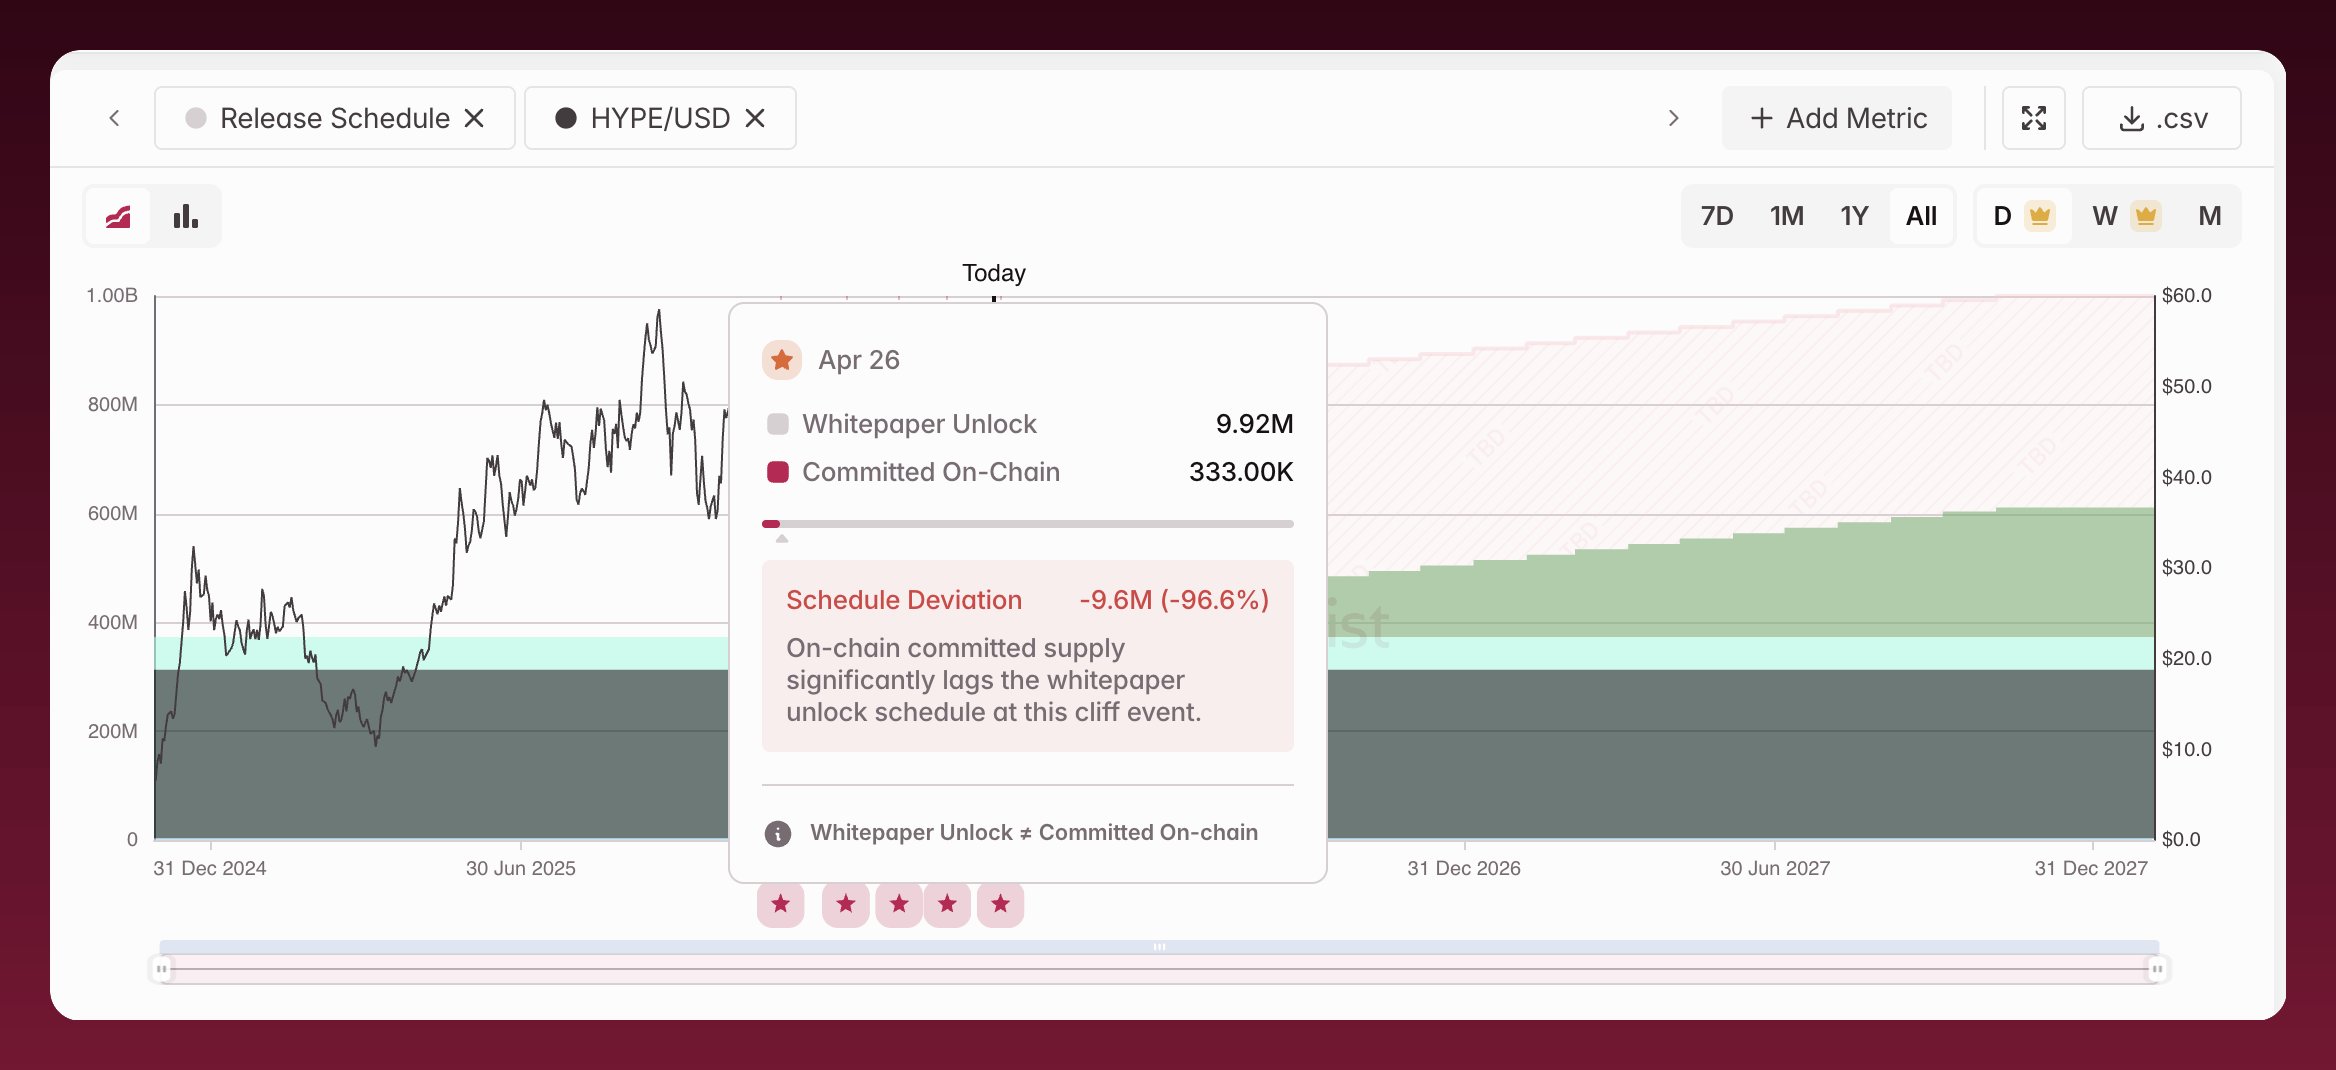
The **Release Schedule** shows how supply enters circulation over time, with interactive tools to customize the view.
On the left, allocations can be toggled individually or regrouped into standard allocations for cross-project comparison. Both the chart and the allocation table update instantly, and **Pro** users can export the full dataset as **CSV** .
The chart offers multiple controls:
* **Modes**: Cumulative stacked (default) or a non-cumulative bar chart
* **Timeframes**: the last 7D, 1M, 1Y, or All for the entire historical and projected view
* **Resolution**: Monthly, **Weekly** , **Daily**
Striped bars highlight **TBD allocations**, making uncertain supply visible. If projects later define these, updates are recorded in the **Historical Changes** panel.
### Unlock lifecycle markers
For tokens with unlock lifecycle tracking (currently [Hyperliquid](https://tokenomist.ai/hyperliquid)), the Release Schedule chart displays **marker icons** on the timeline at dates where:
* An **unlock event** is scheduled (from the whitepaper release schedule)
* The project team has **committed** to a claim (announced via Discord)
These markers help you quickly identify when upcoming supply events are expected and whether the team has confirmed the amounts.
## Emission
This panel focuses on how many tokens have been emitted, or released into circulation, and where those tokens came from. This helps you understand the source of supply growth and token distribution dynamics. On type of unlock, hovering your mouse over the element will show type of unlock, allocations, and unlocked amount in token, USD, and percentage of released supply.
Beside that is the emission component, which standardizes all supply changes into:
* **Inflation**: all positive supply emission from cliff unlocks and linear releases.
* **Deflation**: all negative supply decreases from mechanisms such as burn.
* **Emission**: the difference between inflation and deflation in the timeframe.
### Using Emission
* View by: All / +1D / +7D / +1M / +6M / +1Y / +4Y
* Break down by:
* Group allocation
* Type of unlock:
* [Cliff unlock](/cliff-and-linear-emission): an unlock event that occurs at a set interval greater than one day (e.g., weekly, monthly, quarterly). This represents a discrete, periodic release of tokens.
* [Linear release](/cliff-and-linear-emission): a continuous, daily release of a specific number of tokens. This represents a smooth, predictable increase in the circulating supply.
By default, the timeframe is set to **All**, which is all **historical emissions**.
| Metric | Description |
| --------- | ------------------------------------------------------------------------------------------------------------------------------------------- |
| Deflation | Tokens permanently removed (burned) from circulation. This occurs through either pre-programmed events or manual burns by the project team. |
## Allocations
This table exhibits how the total token supply is allocated across different purposes and groups, offering understanding about who controls the tokens and how future supply will be distributed. Clicking on the element will show precision and assumption of an allocation.
### Using Allocations
* Toggle: Group allocations
| Metric | Description |
| --------------- | --------------------------------------------------------------------- |
| Allocation name | Name of the allocation as stated in data sources or group allocations |
| % of allocation | Percentage of total amount that is allocated to an allocation. |
| Total amount | The total amount of token that is allocated to an allocation. |
## Unlock Progress & Events
The unlock widget shows **total supply status**, i.e., how much of the token's supply is Released, TBD Locked, Unreleased, or Untracked.
To the right of that, the **Notable Cliff Unlocks** shows 1 upcoming cliff unlock events (or **All Historical & 2-year Future Unlock Events with Pro** in [unlock event](/unlock-events-pane)).
These components can be used to gauge the current status of token release progress and any important upcoming release events at a glance.
## Release Schedule
The **Release Schedule** shows how supply enters circulation over time, with interactive tools to customize the view.
On the left, allocations can be toggled individually or regrouped into standard allocations for cross-project comparison. Both the chart and the allocation table update instantly, and **Pro** users can export the full dataset as **CSV** .
The chart offers multiple controls:
* **Modes**: Cumulative stacked (default) or a non-cumulative bar chart
* **Timeframes**: the last 7D, 1M, 1Y, or All for the entire historical and projected view
* **Resolution**: Monthly, **Weekly** , **Daily**
Striped bars highlight **TBD allocations**, making uncertain supply visible. If projects later define these, updates are recorded in the **Historical Changes** panel.
### Unlock lifecycle markers
For tokens with unlock lifecycle tracking (currently [Hyperliquid](https://tokenomist.ai/hyperliquid)), the Release Schedule chart displays **marker icons** on the timeline at dates where:
* An **unlock event** is scheduled (from the whitepaper release schedule)
* The project team has **committed** to a claim (announced via Discord)
These markers help you quickly identify when upcoming supply events are expected and whether the team has confirmed the amounts.
 ### Using Release Schedule
* Add metric:
* Release schedule
* Token / USD
* Token / Token
* Claim : the net amount claimers received from vesting addresses
* Total release supply : the total amount of a token that is unlocked and readily claimable into circulation at any time.
* Cumulative burn : the cumulative total of all tokens that have been permanently removed (burned) from circulation since launch.
* Burn : the amount of tokens removed from circulation during the specific period through burning mechanisms.
* View by: 7D / 1M / 1Y / All
* View by: D / W / M
# View data source
This table gives detailed, verifiable information about each token allocation and how those tokens are released over time. It can help you understand supply mechanics, lockups, and future inflation risk.
| Column name | Description |
| ------------ | --------------------------------------------------------------------- |
| Allocation | Name of the allocation as stated in data sources or group allocations |
| Token amount | The total amount of token that is allocated to an allocation. |
| Assumption | Data used for the vesting chart |
| Precision | The accuracy and specificity of the unlock time |
| Reference | Reference source of information |
| Description | A summary from reference |
Our **Precision & Assumption framework** helps you quickly judge how reliable each piece of tokenomics data is.
**Assumptions** show *where the release data originates*. **Precision** indicates *how exact the timing is*. This framework ensures that you aren't just seeing *what* is set to unlock, but also *how much confidence* you should have in that information.
Learn more at [Precision and Assumption](/precision-and-assumption).
# Why It Matters
The Token Page combines every aspect of supply analysis into one standardized view. This makes it easier to evaluate dilution risk, investor incentives, and long-term sustainability, all in one place.
# FAQs
# Where to next
* Explore more about our token page features: [tokenomics](/tokenomics-pane), [unlock events](/unlock-events-pane), [competitor analysis](/competitor-analysis-pane), [claimed](/claimed-pane), [fundraising](/fundraising-pane), [buyback](/buyback-pane), [burn](/burn-pane), and [updates](/updates-pane).
* Visit [BTC's Overview](https://tokenomist.ai/bitcoin).
### Using Release Schedule
* Add metric:
* Release schedule
* Token / USD
* Token / Token
* Claim : the net amount claimers received from vesting addresses
* Total release supply : the total amount of a token that is unlocked and readily claimable into circulation at any time.
* Cumulative burn : the cumulative total of all tokens that have been permanently removed (burned) from circulation since launch.
* Burn : the amount of tokens removed from circulation during the specific period through burning mechanisms.
* View by: 7D / 1M / 1Y / All
* View by: D / W / M
# View data source
This table gives detailed, verifiable information about each token allocation and how those tokens are released over time. It can help you understand supply mechanics, lockups, and future inflation risk.
| Column name | Description |
| ------------ | --------------------------------------------------------------------- |
| Allocation | Name of the allocation as stated in data sources or group allocations |
| Token amount | The total amount of token that is allocated to an allocation. |
| Assumption | Data used for the vesting chart |
| Precision | The accuracy and specificity of the unlock time |
| Reference | Reference source of information |
| Description | A summary from reference |
Our **Precision & Assumption framework** helps you quickly judge how reliable each piece of tokenomics data is.
**Assumptions** show *where the release data originates*. **Precision** indicates *how exact the timing is*. This framework ensures that you aren't just seeing *what* is set to unlock, but also *how much confidence* you should have in that information.
Learn more at [Precision and Assumption](/precision-and-assumption).
# Why It Matters
The Token Page combines every aspect of supply analysis into one standardized view. This makes it easier to evaluate dilution risk, investor incentives, and long-term sustainability, all in one place.
# FAQs
# Where to next
* Explore more about our token page features: [tokenomics](/tokenomics-pane), [unlock events](/unlock-events-pane), [competitor analysis](/competitor-analysis-pane), [claimed](/claimed-pane), [fundraising](/fundraising-pane), [buyback](/buyback-pane), [burn](/burn-pane), and [updates](/updates-pane).
* Visit [BTC's Overview](https://tokenomist.ai/bitcoin).