> ## Documentation Index
> Fetch the complete documentation index at: https://docs.tokenomist.ai/llms.txt
> Use this file to discover all available pages before exploring further.
# Emission Screener ♕
> Scan emissions across every project and compare dilution risks at a glance
# Emission Screener
## Overview
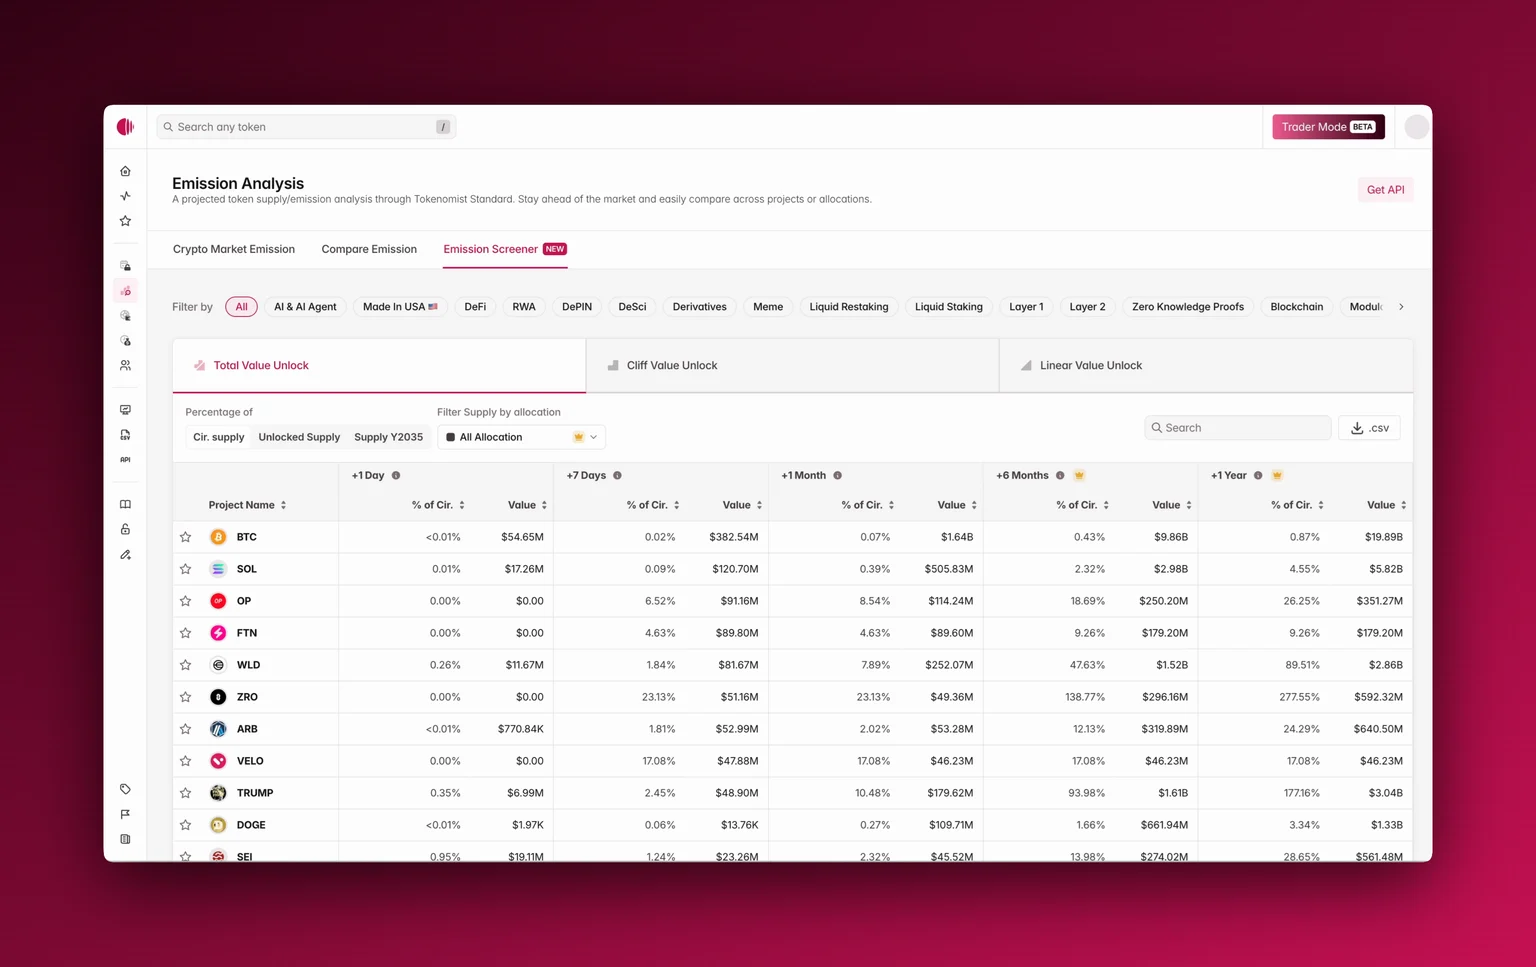
**Emission Screener** provides a tabular overview of emissions across all projects in the market, making it easy to scan every project, compare values, and quickly identify which tokens are contributing the most supply at different time horizons. This makes it simple to spot which projects face near-term dilution pressure and how those compare across categories — whether emissions are concentrated in the next week, spread evenly over a year, or dominated by a single sector.
 ## Accessing Emission Screener
You'll find **Emission Screener** alongside Crypto Market Emission and Emission Comparison in the navigation bar, or through the sidebar. When opened, it defaults to **Total Value Unlock**, but you can also switch to **Cliff Value Unlock** or **Linear Value Unlock** for more specific views.
## Using Emission Screener
The table shows unlock projections across multiple horizons: **+1 day, +7 days, +1 month,** and even up to **+6 months** **, and +1 year** **with Pro**.
Each column displays both the **absolute value in USD** and the **percentage relative to supply**. You can toggle whether these percentages are calculated against **circulating supply**, **unlocked supply**, or the **2035 supply baseline**. Please see [Supply Metrics](/supply-metrics) to learn more about how we define different types of supply.
Filters let you refine the view by **sector** (AI, DeFi, RWA, Layer 1, etc.), or with **Pro**, by **allocation type** . The table is fully searchable, sortable by value or percentage, and **for Pro users** all data can be exported to **CSV** for custom analysis.
## Where To Next?
* Learn how we categorize [cliff and linear releases](/cliff-and-linear-emission).
* Explore our [Supply Metrics](/supply-metrics) definitions for terms like circulating and unlocked supply.
* See how you can utilize [Emission Comparison](/compare-emission) and [Crypto Market Emission](/crypto-market-emission) together with the Emission Screener.
* Export data for custom analysis with [CSV Download](/csv-download).
## Accessing Emission Screener
You'll find **Emission Screener** alongside Crypto Market Emission and Emission Comparison in the navigation bar, or through the sidebar. When opened, it defaults to **Total Value Unlock**, but you can also switch to **Cliff Value Unlock** or **Linear Value Unlock** for more specific views.
## Using Emission Screener
The table shows unlock projections across multiple horizons: **+1 day, +7 days, +1 month,** and even up to **+6 months** **, and +1 year** **with Pro**.
Each column displays both the **absolute value in USD** and the **percentage relative to supply**. You can toggle whether these percentages are calculated against **circulating supply**, **unlocked supply**, or the **2035 supply baseline**. Please see [Supply Metrics](/supply-metrics) to learn more about how we define different types of supply.
Filters let you refine the view by **sector** (AI, DeFi, RWA, Layer 1, etc.), or with **Pro**, by **allocation type** . The table is fully searchable, sortable by value or percentage, and **for Pro users** all data can be exported to **CSV** for custom analysis.
## Where To Next?
* Learn how we categorize [cliff and linear releases](/cliff-and-linear-emission).
* Explore our [Supply Metrics](/supply-metrics) definitions for terms like circulating and unlocked supply.
* See how you can utilize [Emission Comparison](/compare-emission) and [Crypto Market Emission](/crypto-market-emission) together with the Emission Screener.
* Export data for custom analysis with [CSV Download](/csv-download).