> ## Documentation Index
> Fetch the complete documentation index at: https://docs.tokenomist.ai/llms.txt
> Use this file to discover all available pages before exploring further.
# Crypto Market Emission
> Track token supply being released across the entire market
# Crypto Market Emission
## Overview
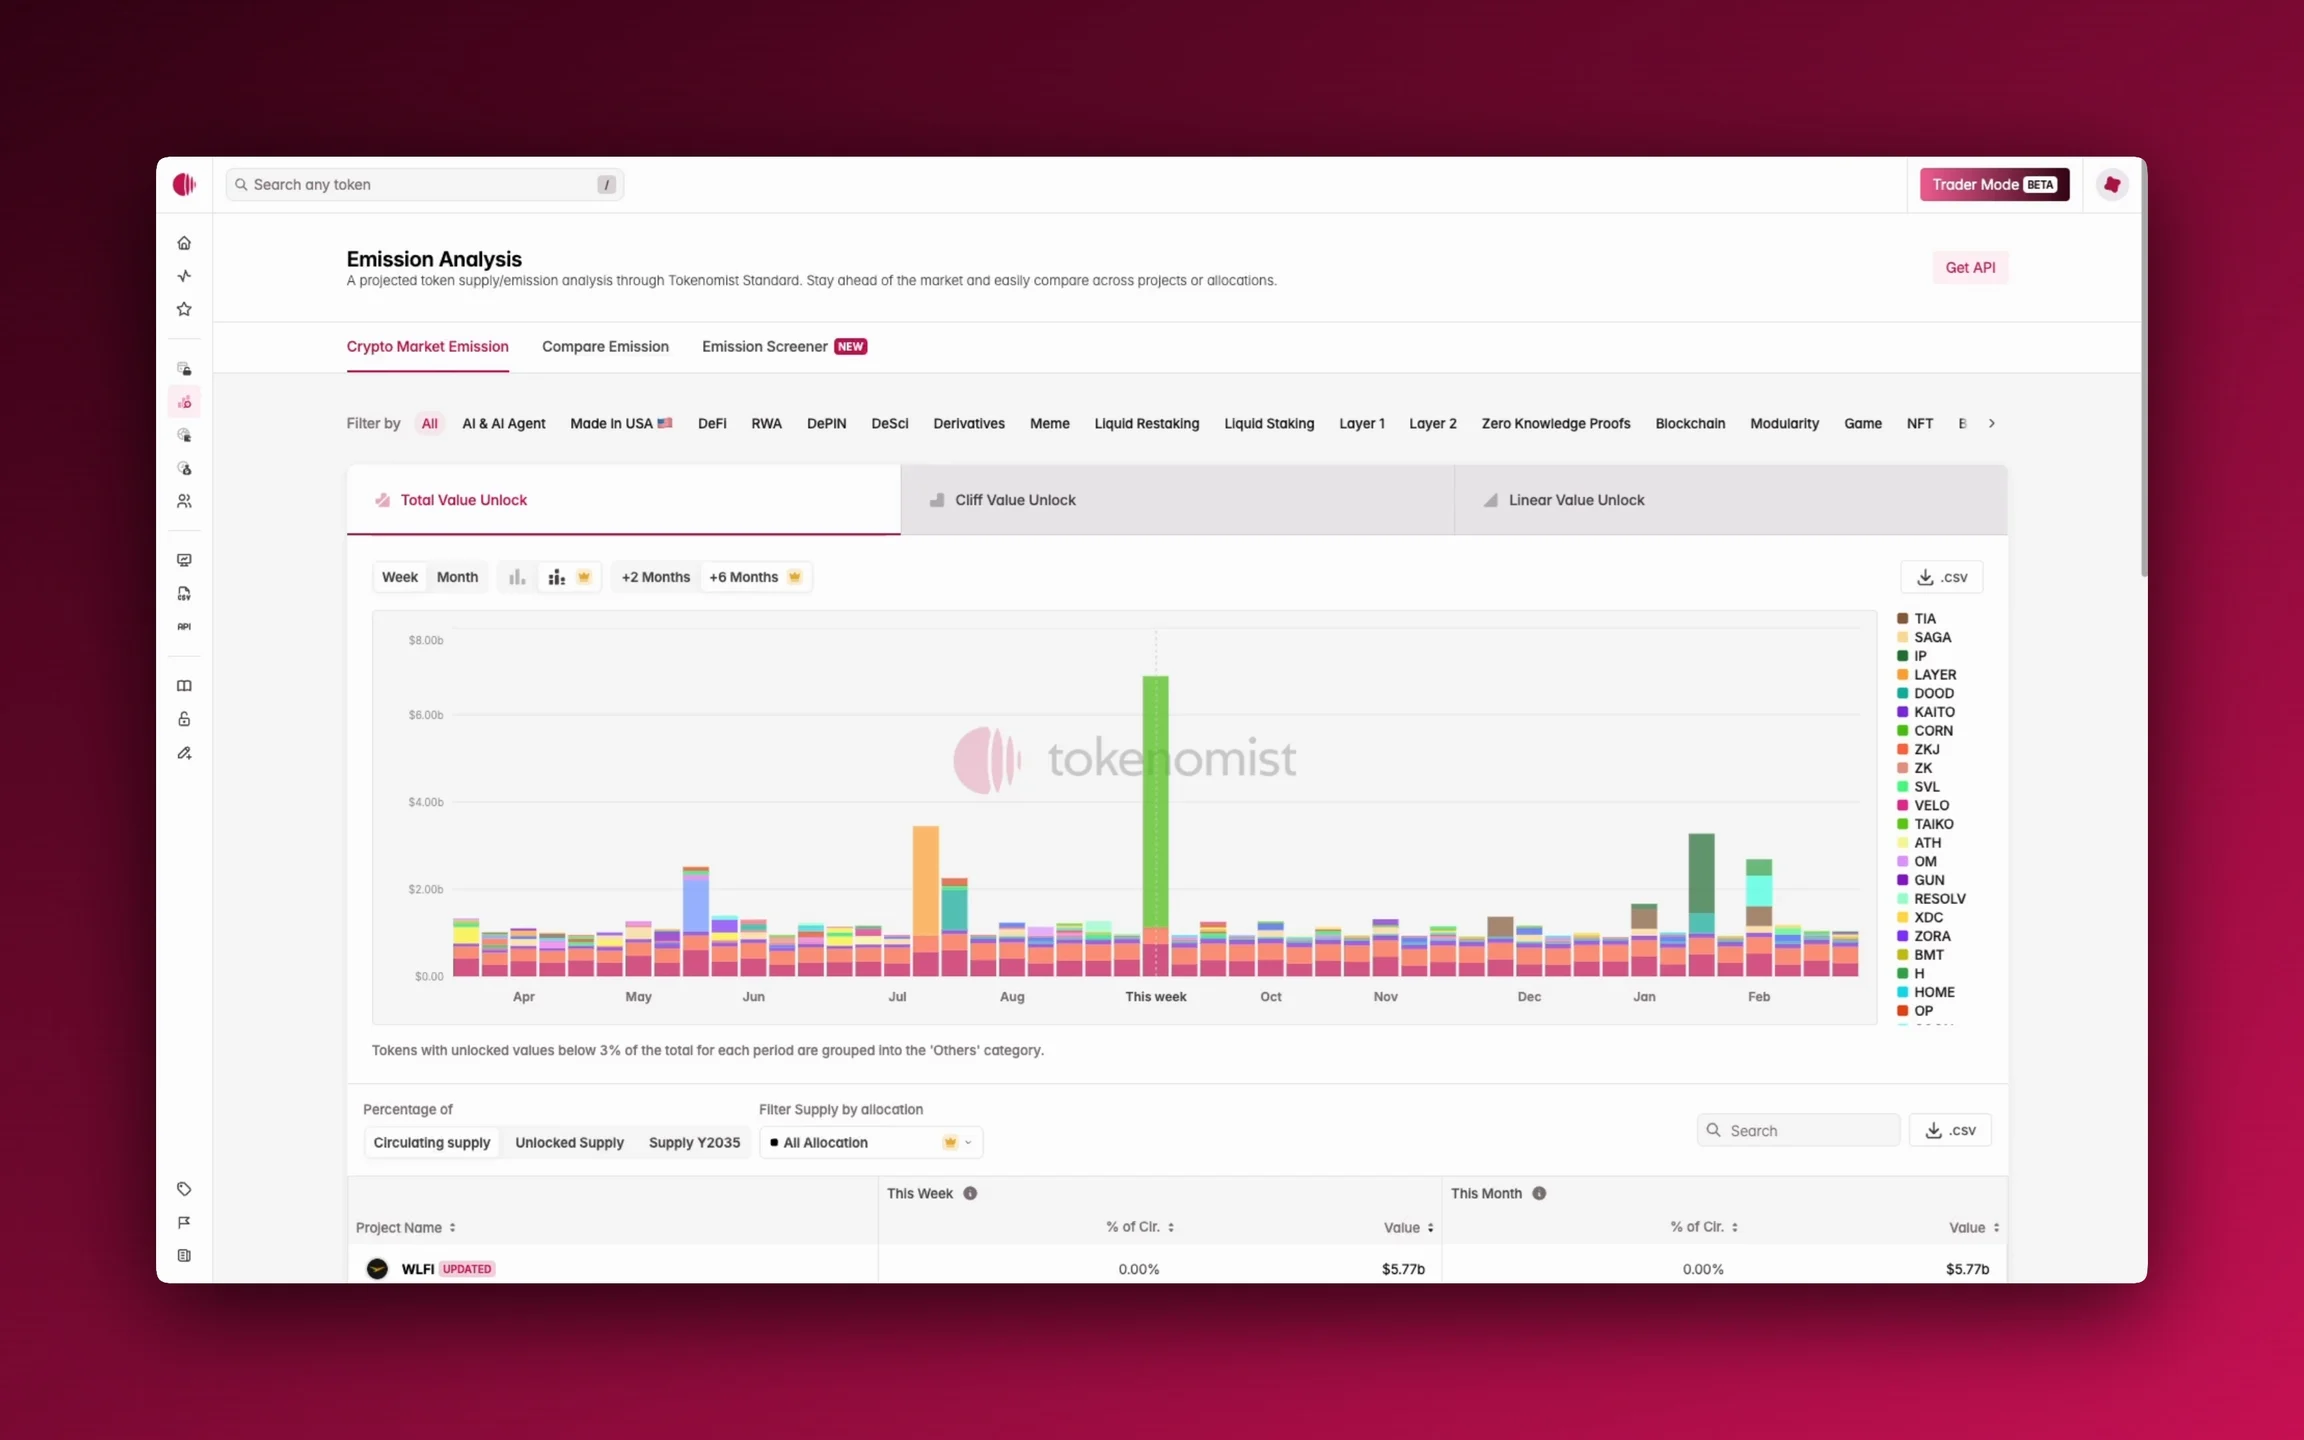
**Crypto Market Emission** lets you track how much token supply is entering circulation across the entire crypto market. This gives you a clear sense of not just *when* tokens are being released, but also *how much value* is being released at any given time, helping you anticipate when liquidity pressure may increase across the industry. For example, a \$100m unlock from one project may look large on its own, but when seen as part of \$2b in cumulative unlocks happening the same week, the bigger picture becomes clear.
 ## Accessing Crypto Market Emission
You can open **Crypto Market Emission** directly from the sidebar. Once inside, you'll see an interactive chart displaying the total market value of tokens unlocking over time. A toggle at the top lets you switch views between
* **Total Value Unlock**, which aggregates everything
* **Cliff Value Unlock**, which highlights cliff releases
* **Linear Value Unlock**, which filters only the steady drip of ongoing emissions
## Using Crypto Market Emission
By default, emissions are shown in a **rolling 5-month window (+2 / -2 months)**, while **Pro users** can extend this to a **13-month horizon (+6 / -6 months)** for a broader outlook.
The chart can be viewed **weekly** or **monthly**, and toggled between **total value** or, on **Pro**, broken down by **individual** **tokens** . When grouped by tokens, tokens with unlocked values below a certain percentage of the total for each period are grouped into the '**Others**' category. For more details please see [below](#others-percentage-criteria).
Beneath the chart, a table shows which tokens are driving emissions during the selected window. You can check unlocks for the current week or month, and compare them against **circulating supply**, **unlocked supply**, or **long-term supply through 2035**. It helps you spot upcoming inflation and possible market impact.
**Filters** add another layer of context. Emissions can be narrowed to sectors such as AI, DeFi, Layer 1, or NFT tokens, while **Pro** accounts also filter by **allocation type** .
Finally, both the chart and table can be exported as **CSV files** so you can analyze the data in your own models.
## Others Percentage Criteria
When grouping the Crypto Market Emission chart by tokens, tokens with unlocked values below a certain percent of the total for each period are grouped into the '**Others**' category.
The thresholds for the **Others** cutoff are as follows
| Week | 2M | 6M |
| ------ | -- | -- |
| All | 2% | 3% |
| Cliff | 3% | 5% |
| Linear | 1% | 1% |
| Month | 2M | 6M |
| ------ | -- | -- |
| All | 1% | 2% |
| Cliff | 3% | 5% |
| Linear | 1% | 1% |
## Where To Next?
* Learn how we categorize [cliff and linear releases](/cliff-and-linear-emission).
* Explore our [Supply Metrics](/supply-metrics) definitions for terms like circulating and unlocked supply.
* See how you can utilize [Emission Comparison](/compare-emission) and [Emission Screener](/emission-screener) together with Crypto Market Emission.
* Export data for custom analysis with [CSV Download](/csv-download).
## Accessing Crypto Market Emission
You can open **Crypto Market Emission** directly from the sidebar. Once inside, you'll see an interactive chart displaying the total market value of tokens unlocking over time. A toggle at the top lets you switch views between
* **Total Value Unlock**, which aggregates everything
* **Cliff Value Unlock**, which highlights cliff releases
* **Linear Value Unlock**, which filters only the steady drip of ongoing emissions
## Using Crypto Market Emission
By default, emissions are shown in a **rolling 5-month window (+2 / -2 months)**, while **Pro users** can extend this to a **13-month horizon (+6 / -6 months)** for a broader outlook.
The chart can be viewed **weekly** or **monthly**, and toggled between **total value** or, on **Pro**, broken down by **individual** **tokens** . When grouped by tokens, tokens with unlocked values below a certain percentage of the total for each period are grouped into the '**Others**' category. For more details please see [below](#others-percentage-criteria).
Beneath the chart, a table shows which tokens are driving emissions during the selected window. You can check unlocks for the current week or month, and compare them against **circulating supply**, **unlocked supply**, or **long-term supply through 2035**. It helps you spot upcoming inflation and possible market impact.
**Filters** add another layer of context. Emissions can be narrowed to sectors such as AI, DeFi, Layer 1, or NFT tokens, while **Pro** accounts also filter by **allocation type** .
Finally, both the chart and table can be exported as **CSV files** so you can analyze the data in your own models.
## Others Percentage Criteria
When grouping the Crypto Market Emission chart by tokens, tokens with unlocked values below a certain percent of the total for each period are grouped into the '**Others**' category.
The thresholds for the **Others** cutoff are as follows
| Week | 2M | 6M |
| ------ | -- | -- |
| All | 2% | 3% |
| Cliff | 3% | 5% |
| Linear | 1% | 1% |
| Month | 2M | 6M |
| ------ | -- | -- |
| All | 1% | 2% |
| Cliff | 3% | 5% |
| Linear | 1% | 1% |
## Where To Next?
* Learn how we categorize [cliff and linear releases](/cliff-and-linear-emission).
* Explore our [Supply Metrics](/supply-metrics) definitions for terms like circulating and unlocked supply.
* See how you can utilize [Emission Comparison](/compare-emission) and [Emission Screener](/emission-screener) together with Crypto Market Emission.
* Export data for custom analysis with [CSV Download](/csv-download).